Please note javascript is required for full website functionality.

Charts And Dashboards Blogs

Charts And Dashboards Blogs

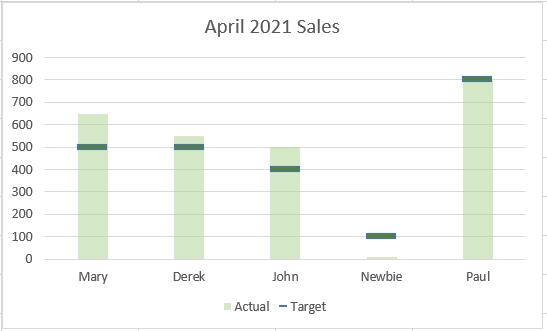
Charts and Dashboards: More Target Practice

18 June 2021

Welcome back to our Charts and Dashboards blog series. This week, I look at another way to create a presentation of actual sales vs. target sales.


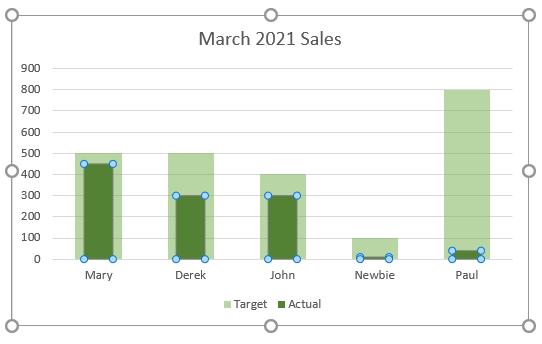
Charts and Dashboards: Target Practice

11 June 2021

Welcome back to our Charts and Dashboards blog series. This week, I look at creating a presentation of actual vs. target sales.


Charts and Dashboards: A Bar Chart with Dynamic Ordering – Part 2

4 June 2021

Welcome back to this week’s Charts and Dashboards blog series. This week, we will continue to talk about the bar chart with dynamic ordering.


Charts and Dashboards: A Bar Chart with Dynamic Ordering – Part 1

21 May 2021

Welcome back to this week’s Charts and Dashboards blog series. Over the next two weeks, we will discuss creating a bar chart with dynamic ordering.


Charts and Dashboards: Chart Titles as a Text Box

14 May 2021

Welcome back to this week’s Charts and Dashboards blog series. This week, we will talk about creating a chart title using a text box.


Charts and Dashboards: Moving Chart Labels – Part 2

7 May 2021

Welcome back to this week’s Charts and Dashboards blog series. This week, we will continue to discuss about the moving chart labels.


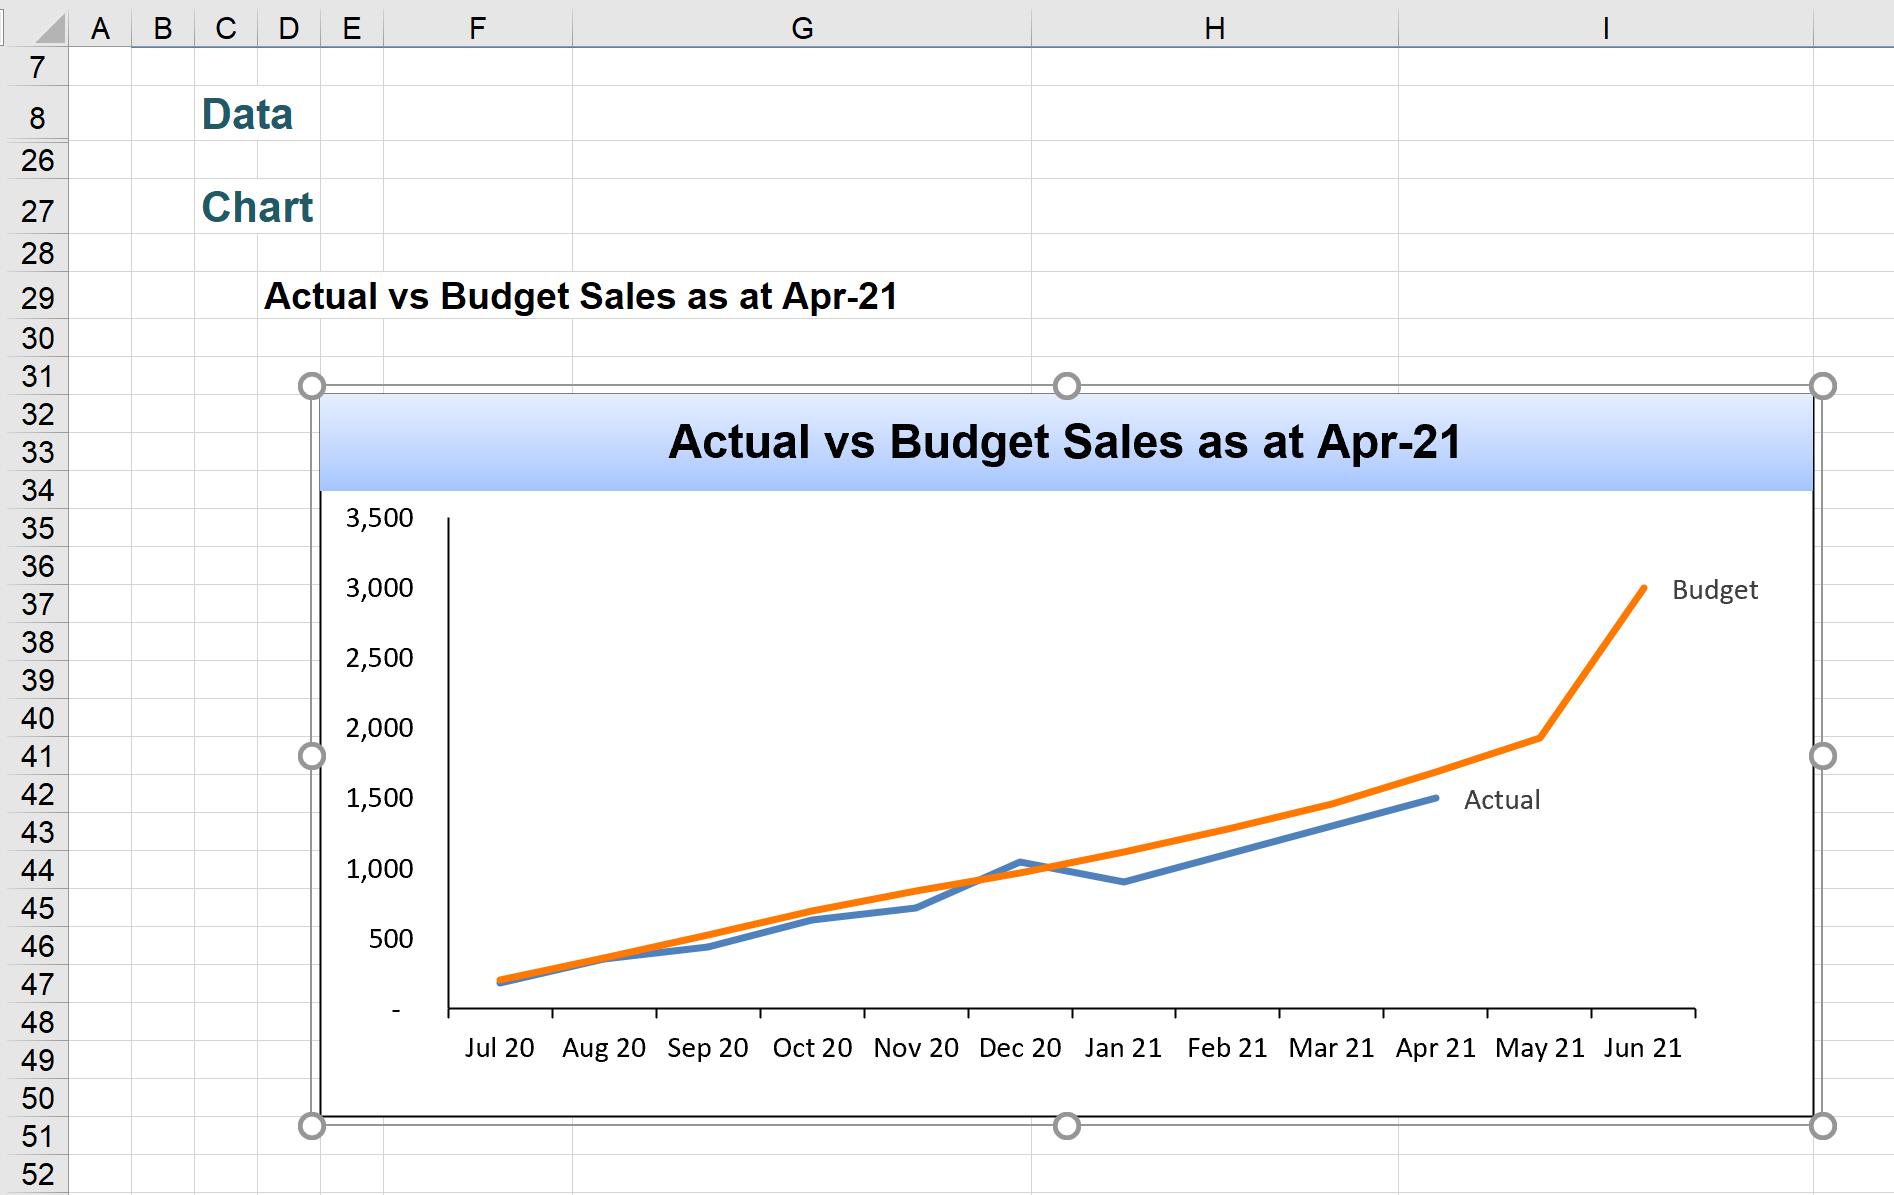
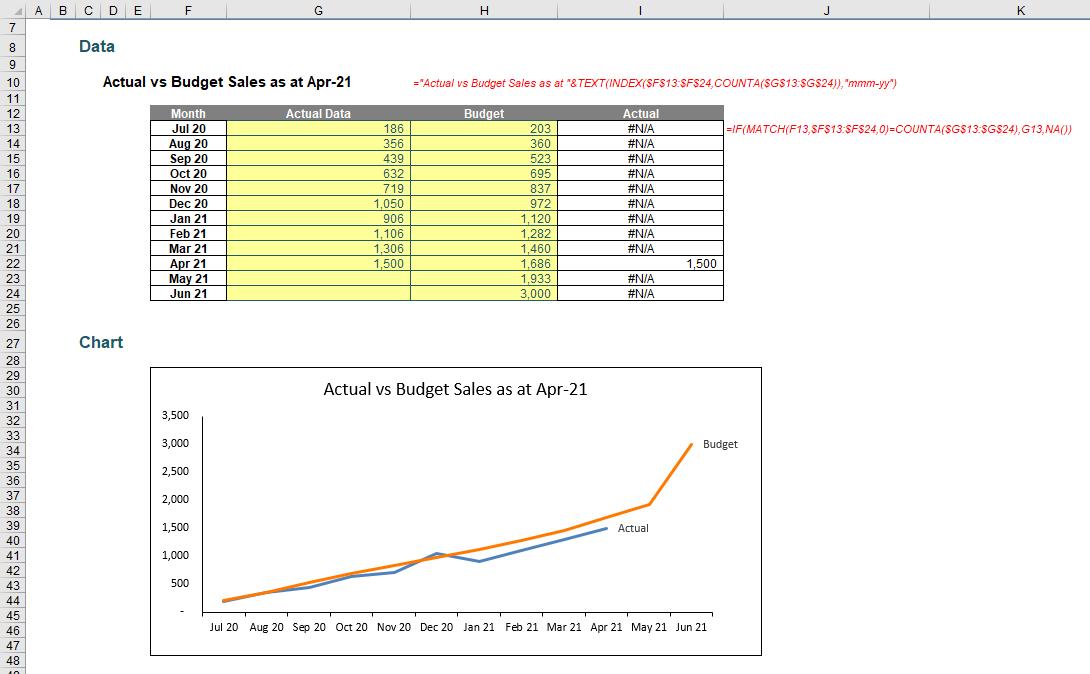
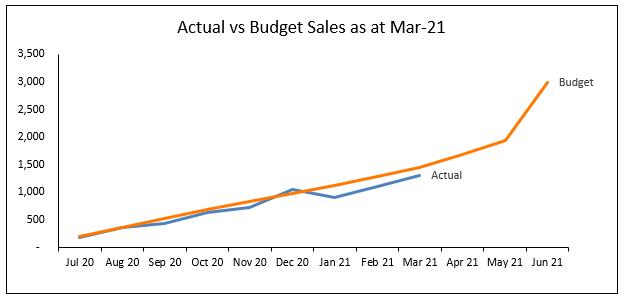
Charts and Dashboards: Moving Chart Labels – Part 1

23 April 2021

Welcome back to this week’s Charts and Dashboards blog series. This week, we will talk about creating a chart label that can move.


Charts and Dashboards: Dynamic Legend

16 April 2021

Welcome back to this week’s Charts and Dashboards blog series. This week, we will talk about how to create a dynamic legend.


Charts and Dashboards: Conditional Donut Chart – Part 3

2 April 2021

Welcome back to this week’s Charts and Dashboards blog series. This week, we will get the data label in the “conditional donut chart”.


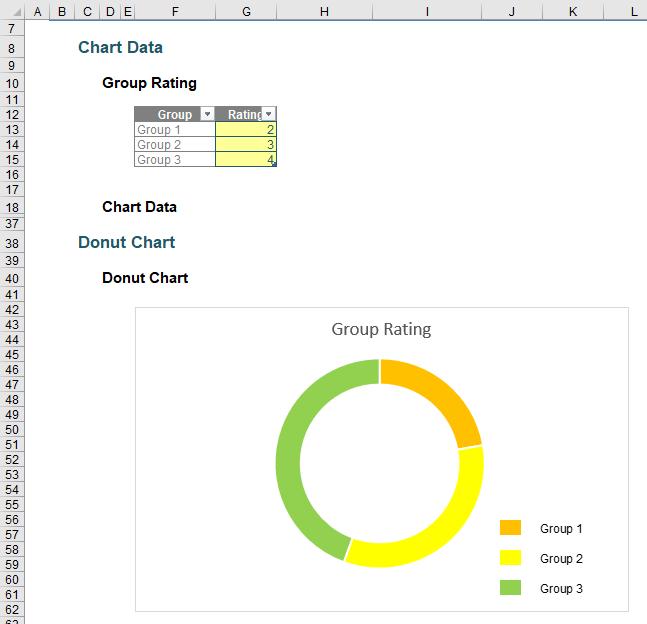
Charts and Dashboards: Conditional Donut Chart – Part 2

19 March 2021

Welcome back to this week’s Charts and Dashboards blog series. This week, we will continue to build the “conditional donut chart”.


Newsletter