Please note javascript is required for full website functionality.

Charts And Dashboards Blogs

Charts And Dashboards Blogs

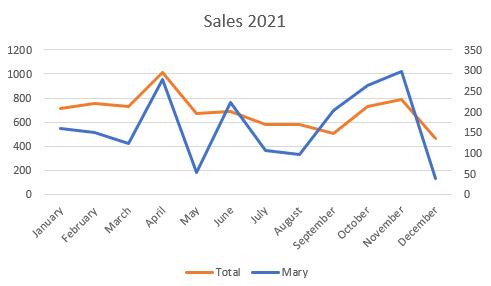
Charts and Dashboards: Presentation Pitfalls Part 2

11 February 2022

Welcome back to our Charts and Dashboards blog series. This week, I look at one of the pitfalls when using charts with multiple axes.


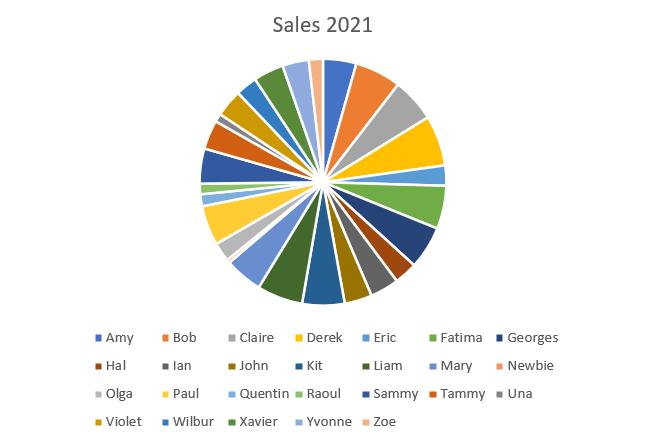
Charts and Dashboards: Presentation Pitfalls Part 1

4 February 2022

Welcome back to our Charts and Dashboards blog series. This week, I look at what can happen when the chart is inappropriate for the data.


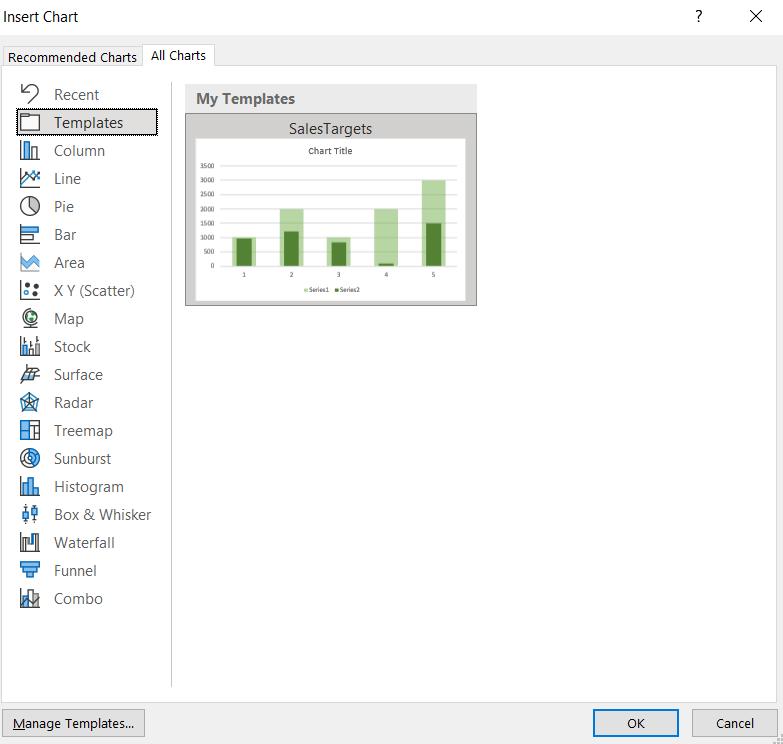
Charts and Dashboards: Time-Saving Template

21 January 2022

Welcome back to our Charts and Dashboards blog series. This week, I save a customised chart to use again.


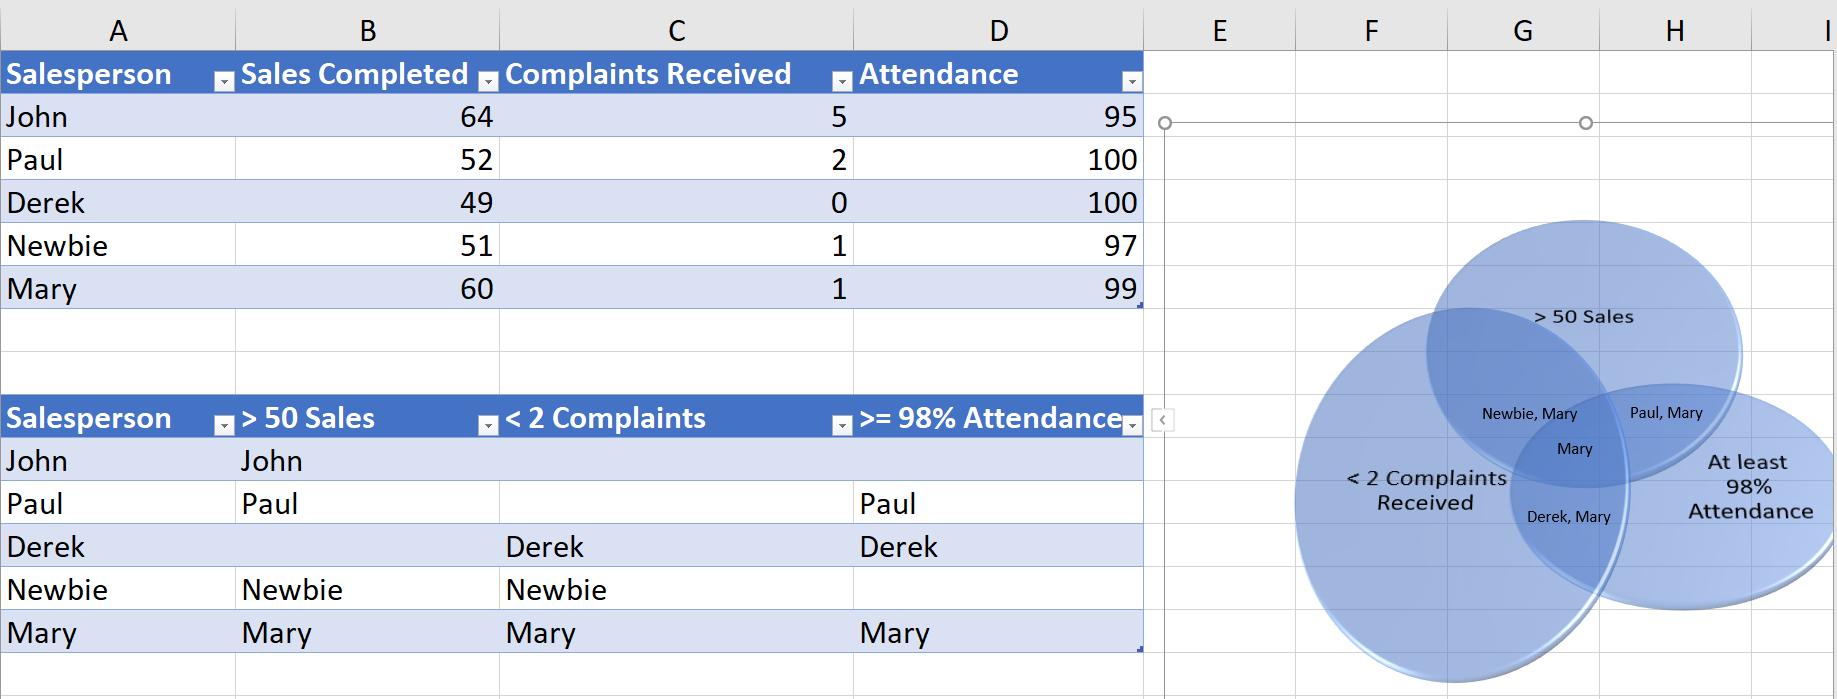
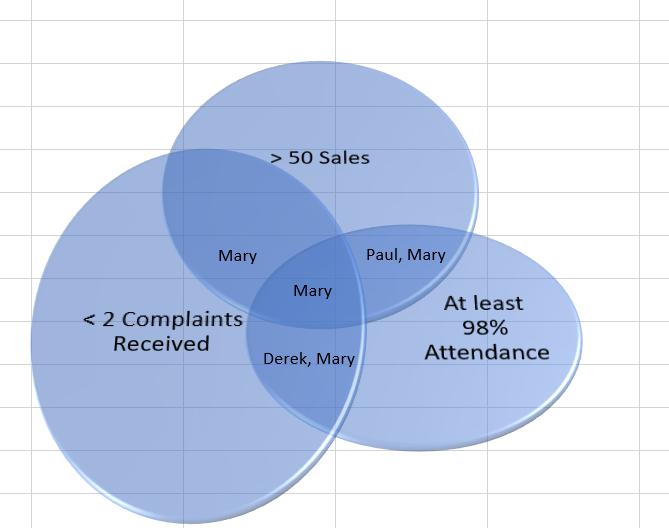
Charts and Dashboards: Venn Diagrams Part 3

14 January 2022

Welcome back to our Charts and Dashboards blog series. This week, I continue looking at Venn Diagrams, by adding dynamic labels to my example.


Charts and Dashboards: Venn Diagrams Part 2

7 January 2022

Welcome back to our Charts and Dashboards blog series. This week, I continue looking at Venn Diagrams.


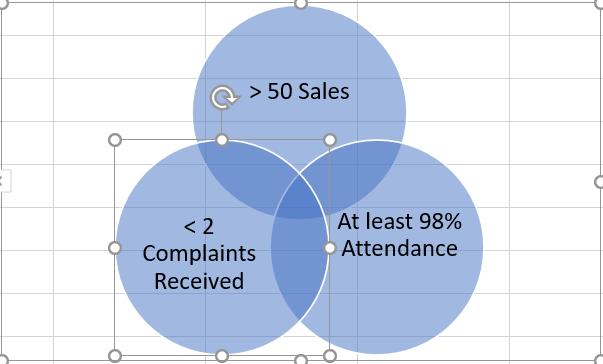
Charts and Dashboards: Venn Diagrams Part 1

24 December 2021

Welcome back to our Charts and Dashboards blog series. This week, I look at Venn Diagrams.


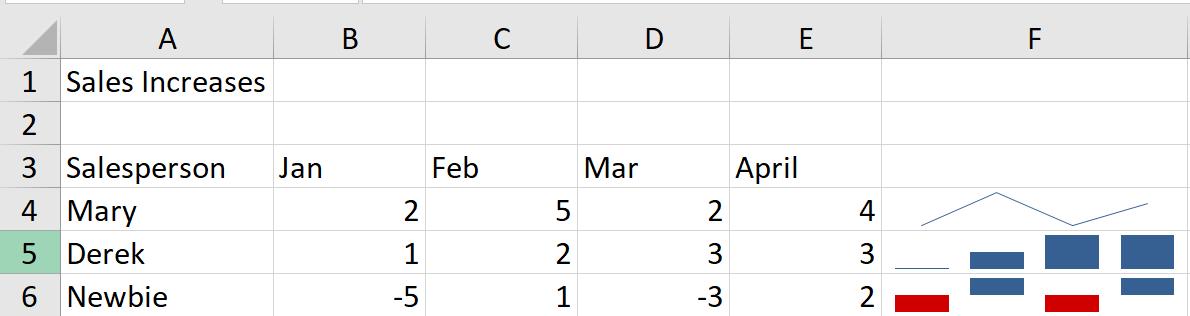
Charts and Dashboards: Sparkling Sparklines Part 2

19 November 2021

Welcome back to our Charts and Dashboards blog series. This week, I continue my revisit of Sparklines.


Charts and Dashboards: Sparkling Sparklines Part 1

12 November 2021

Welcome back to our Charts and Dashboards blog series. This week, I return to Sparklines.


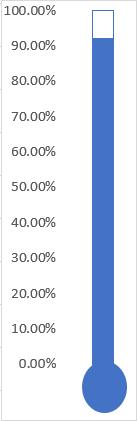
Charts and Dashboards: Thermometer Chart Part 2

5 November 2021

Welcome back to our Charts and Dashboards blog series. This week, I finish creating a Thermometer chart.


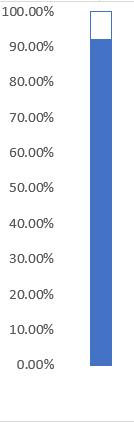
Charts and Dashboards: Thermometer Chart Part 1

22 October 2021

Welcome back to our Charts and Dashboards blog series. This week, I start to create a Thermometer chart.


Newsletter