
Charts and Dashboards: Presentation Pitfalls Part 2
11 February 2022
Welcome back to our Charts and Dashboards blog series. This week, I look at one of the pitfalls when using charts with multiple axes.
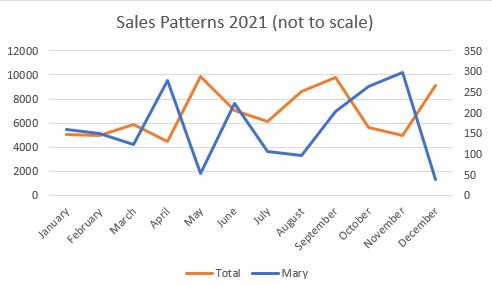
Consider the following chart, which purports to show how well legendary salesperson Mary performed last year:
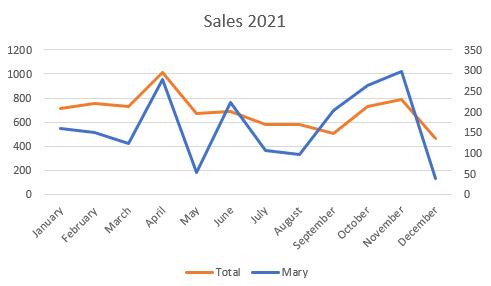
Mary had an extremely successful autumn, but she couldn’t have achieved better sales than the whole team! The scales of the vertical axes are not consistent, and although it makes the chart look pretty, it is misleading. I haven’t tried to make the chart look like this; it was the default scale when I selected to show Mary’s Data Series on a Secondary Axis.
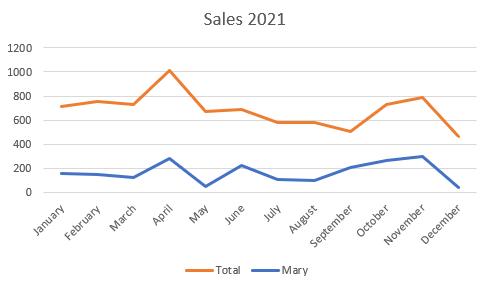
Clearly for this example, I can simply right-click and delete the second vertical axis:
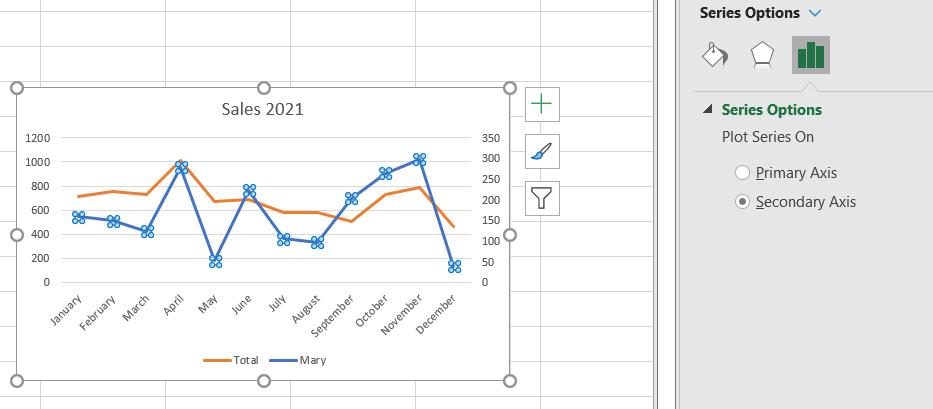
However, it is sometimes useful to use two vertical axes when the amounts are different, but the aim is to show trends. Let’s compare Mary to the rest of the division, not just her team:
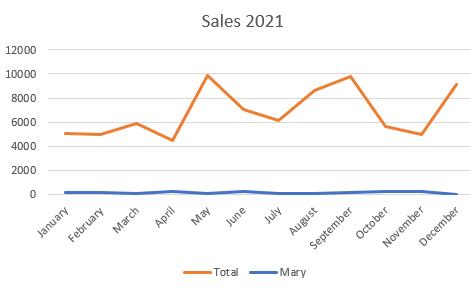
With just one vertical axis, Mary’s sales are not looking good. If I click on Mary’s Data Series, I can right-click to access the ‘Format Data Series’ pane:
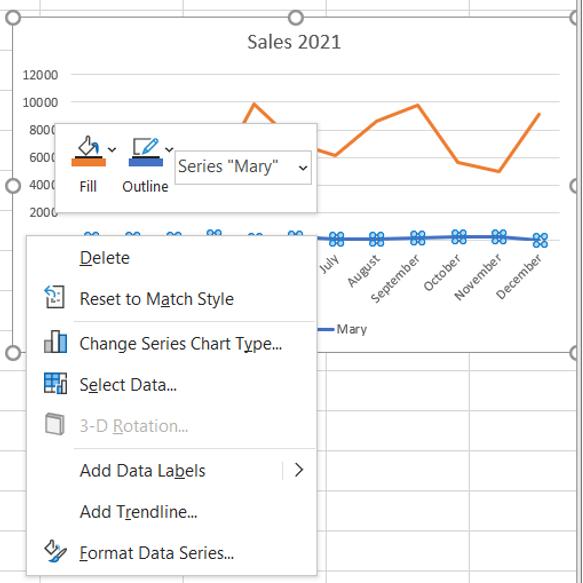
In the ‘Series Options’ tab, there is an option to change where the series is plotted:
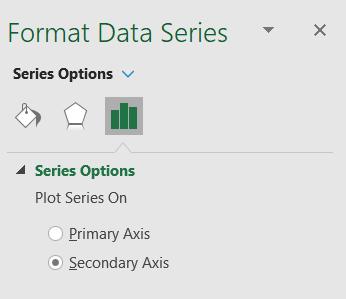
If I change from ‘Secondary Axis’ to ‘Primary Axis’, and then back to ‘Secondary Axis’, another vertical axis is added:
Another way to control the vertical axis used for Mary’s Data Series is to choose the ‘Change Series Chart Type’ option from the right-click menu:
In the ‘Change Series Chart Type’ dialog, I can specify a Secondary Axis for Mary’s Data Series:
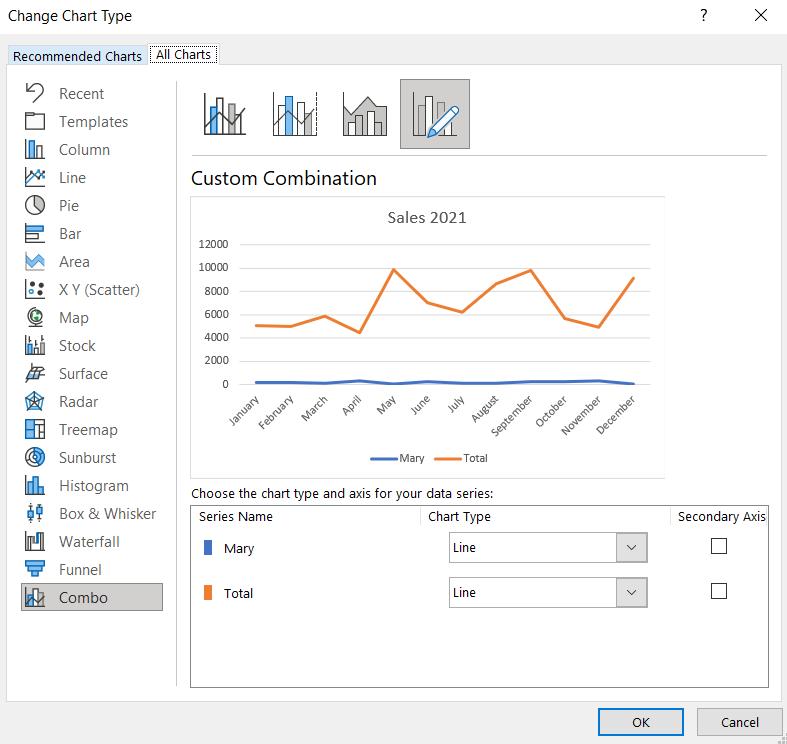
Ticking the box changes the view of the Line chart in the dialog:
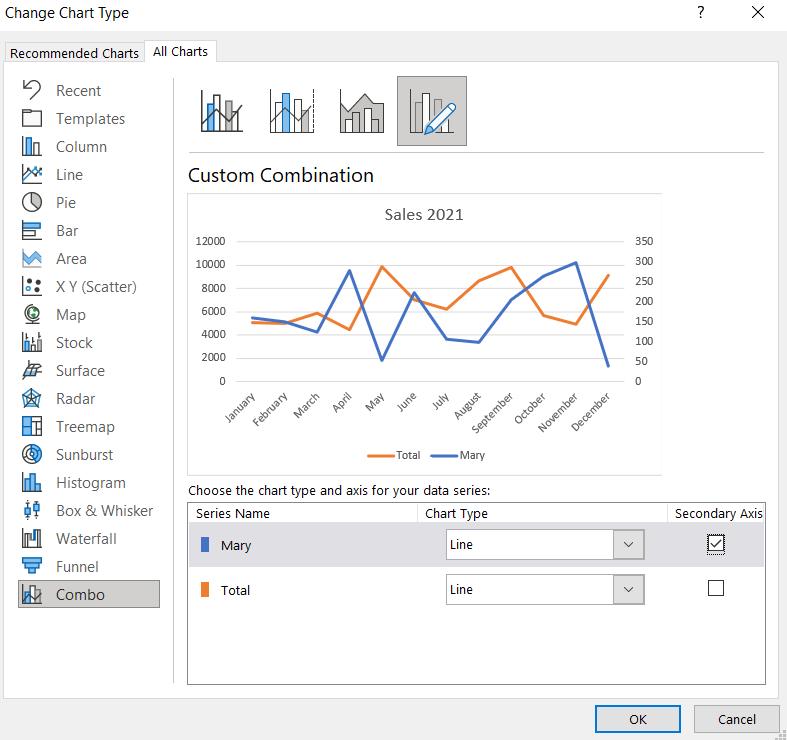
This allows us to see the pattern of sales for Mary versus the total sales, but it should not be used to compare amounts:
Changing the title should make it easier to interpret what the Line chart is showing. I will look at more pitfalls with multiple vertical axes next time.
That’s it for this week. Come back next week for more Charts and Dashboards tips.