
Charts And Dashboards Blogs
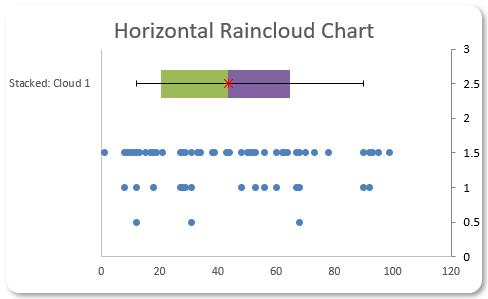
Charts and Dashboards: The Horizontal Raincloud Chart – Part 4
1 December 2023
Charts and Dashboards: The Horizontal Raincloud Chart – Part 3
17 November 2023
Charts and Dashboards: The Horizontal Raincloud Chart – Part 2
10 November 2023
Charts and Dashboards: The Horizontal Raincloud Chart – Part 1
3 November 2023
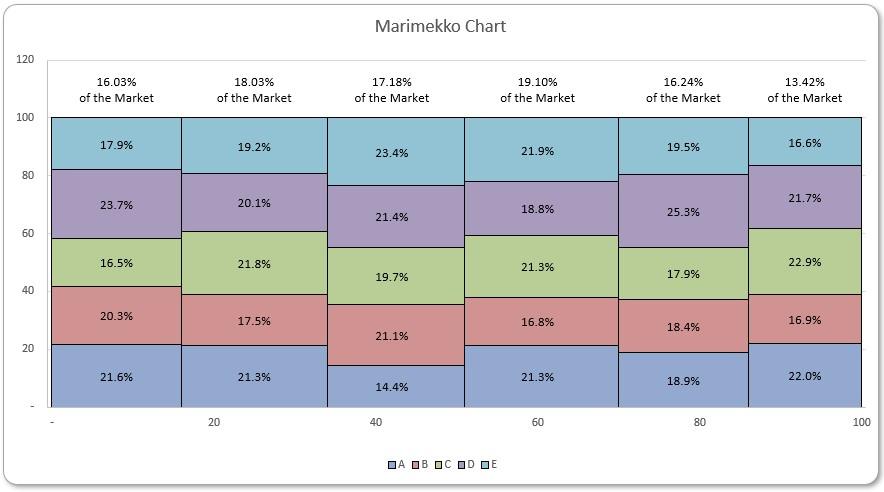
Charts and Dashboards: The Marimekko Chart – Part 4
20 October 2023

Charts and Dashboards: The Marimekko Chart – Part 3
13 October 2023

Charts and Dashboards: The Marimekko Chart – Part 2
6 October 2023

Charts and Dashboards: The Marimekko Chart – Part 1
22 September 2023
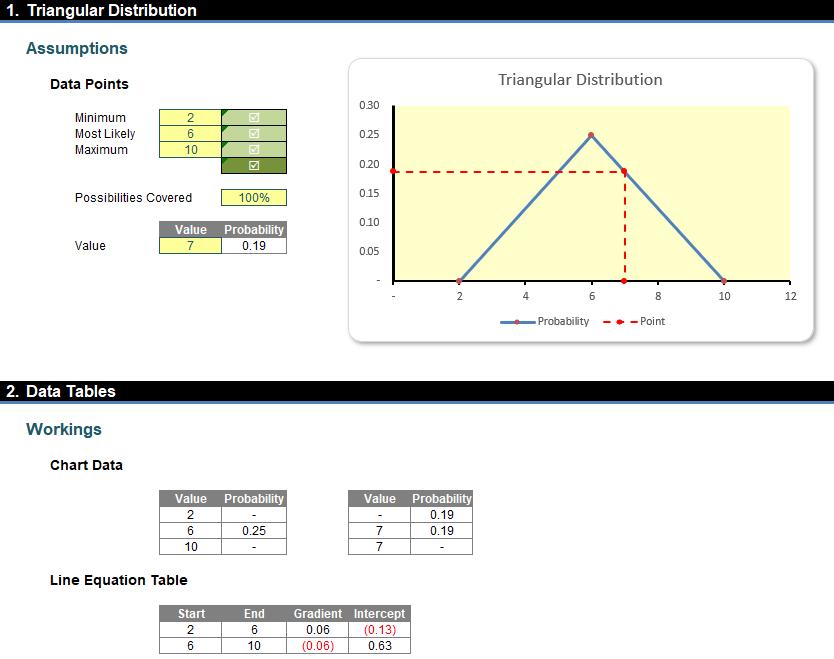
Charts and Dashboards: The Triangular Distribution Chart
15 September 2023
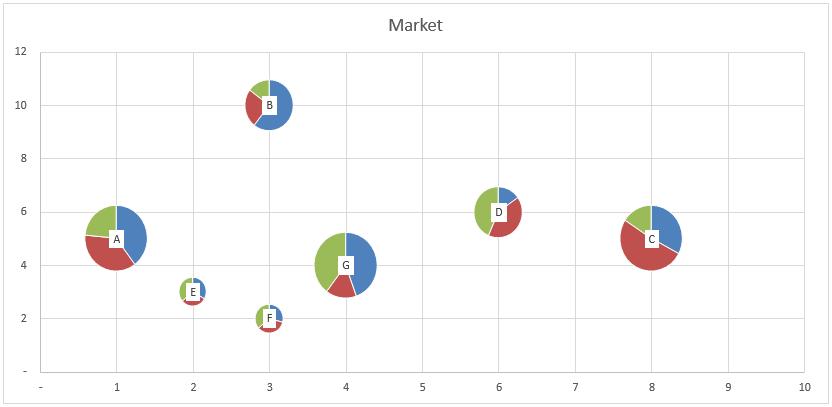
Charts and Dashboards: The Bubble Pie Chart - Part 3
8 September 2023