Please note javascript is required for full website functionality.

Charts And Dashboards Blogs

Charts And Dashboards Blogs

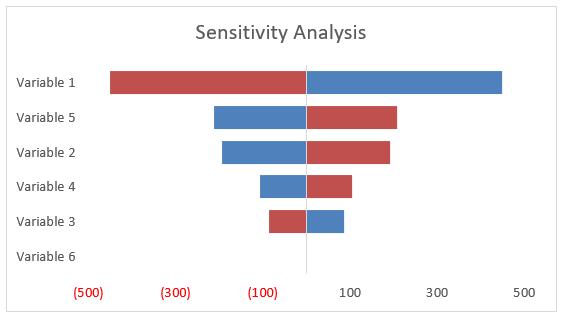
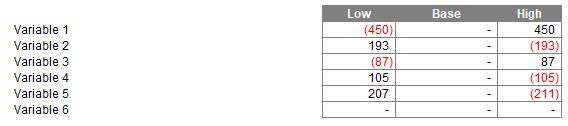
Charts and Dashboards: Tornado Charts - Part 3

13 May 2022

Welcome back to our Charts and Dashboards blog series. This week, we’ll finalise the formatting of our Tornado chart.


Charts and Dashboards: Tornado Charts - Part 2

6 May 2022

Welcome back to our Charts and Dashboards blog series. This week, we’ll begin to construct a Tornado chart.


Charts and Dashboards: Tornado Charts - Part 1

22 April 2022

Welcome back to our Charts and Dashboards blog series. This week, we consider tornado charts and their uses.


Charts and Dashboards: Creating Comparable Charts - Part 2

15 April 2022

Welcome back to our Charts and Dashboards blog series. This week, we finalise our charts from last week by creating similarly-scaled axes.


Charts and Dashboards: Creating Comparable Charts - Part 1

8 April 2022

Welcome back to our Charts and Dashboards blog series. This week, we look at how to easily create a set of comparable charts with similarly-scaled axes.


Charts and Dashboards: Conditional Chart Labelling – Part 4

1 April 2022

Welcome back to our Charts and Dashboards blog series. This week, I take the final step and ensure my solution is sufficiently robust. Anything else would be (April) foolish!


Charts and Dashboards: Conditional Chart Labelling – Part 3

18 March 2022

Welcome back to our Charts and Dashboards blog series. This week, I take the next step towards creating conditional chart labels by exploring how I can apply conditional formatting in data labels.


Charts and Dashboards: Conditional Chart Labelling – Part 2

11 March 2022

Welcome back to our Charts and Dashboards blog series. This week, I take the next step towards producing conditional chart labels by creating the chart.


Charts and Dashboards: Conditional Chart Labelling – Part 1

4 March 2022

Welcome back to our Charts and Dashboards blog series. This week, I take the first step towards creating conditional chart labels by producing multiple number formats.


Charts and Dashboards: Presentation Pitfalls Part 3

18 February 2022

Welcome back to our Charts and Dashboards blog series. This week, I look at more pitfalls when using Charts with multiple axes.


Newsletter