Please note javascript is required for full website functionality.

Charts And Dashboards Blogs

Charts And Dashboards Blogs

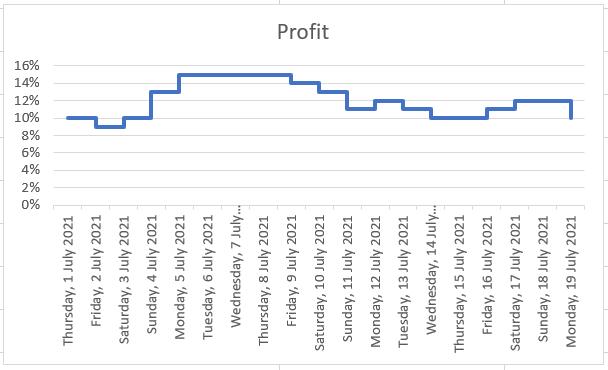
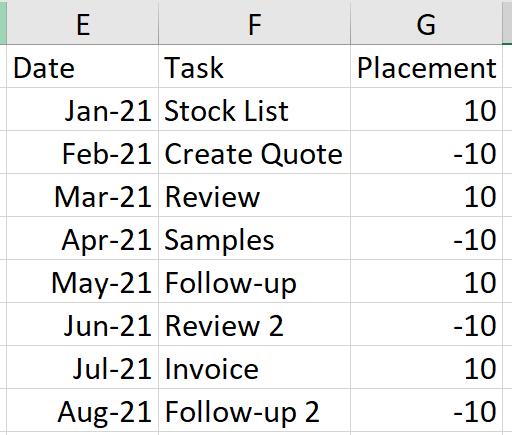
Charts and Dashboards: Step Chart

15 October 2021

Welcome back to our Charts and Dashboards blog series. This week, I create a Step chart.


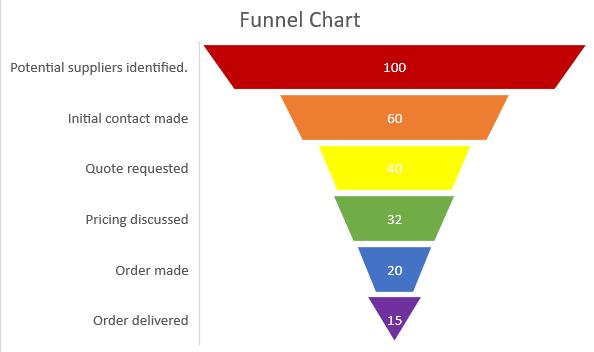
Charts and Dashboards: Sales Funnel Chart – Part 2

8 October 2021

Welcome back to our Charts and Dashboards blog seriesThis week, I again create a Sales Funnel chart, but this time using Excel’s built-in features.


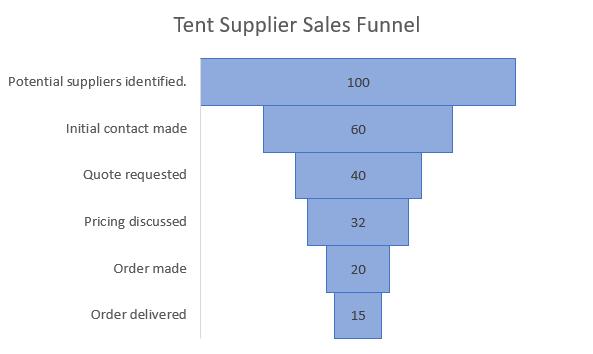
Charts and Dashboards: Sales Funnel Chart – Part 1

1 October 2021

Welcome back to our Charts and Dashboards blog series. This week, I create a Sales Funnel chart.


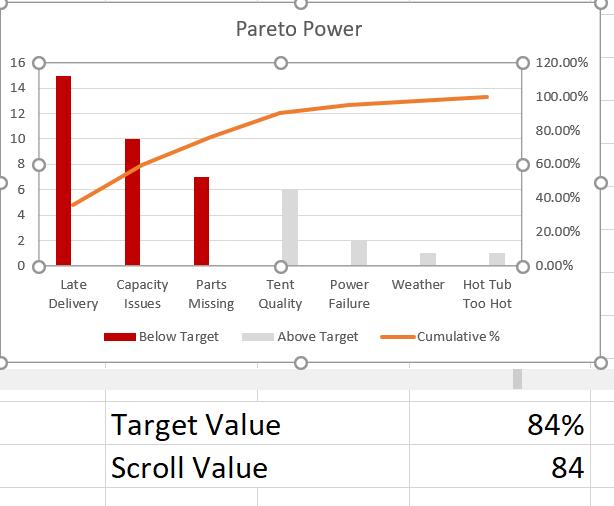
Charts and Dashboards: Pareto Power

20 August 2021

Welcome back to our Charts and Dashboards blog series. This week, I make my manually created Pareto chart interactive


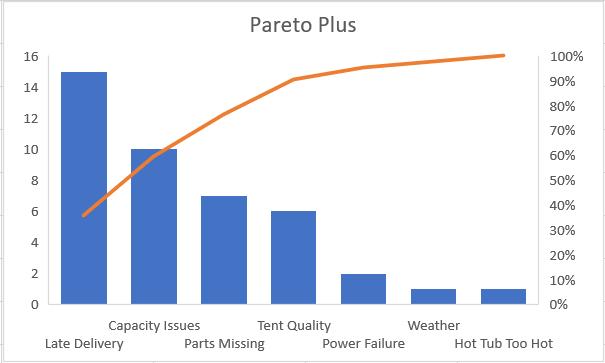
Charts and Dashboards: Pareto Plus

13 August 2021

Welcome back to our Charts and Dashboards blog series. This week, I look at the Pareto Chart option available in Excel 2016 onwards.


Charts and Dashboards: Problem Solving with Pareto Charts

6 August 2021

Welcome back to our Charts and Dashboards blog series. This week, I look at a Pareto chart.


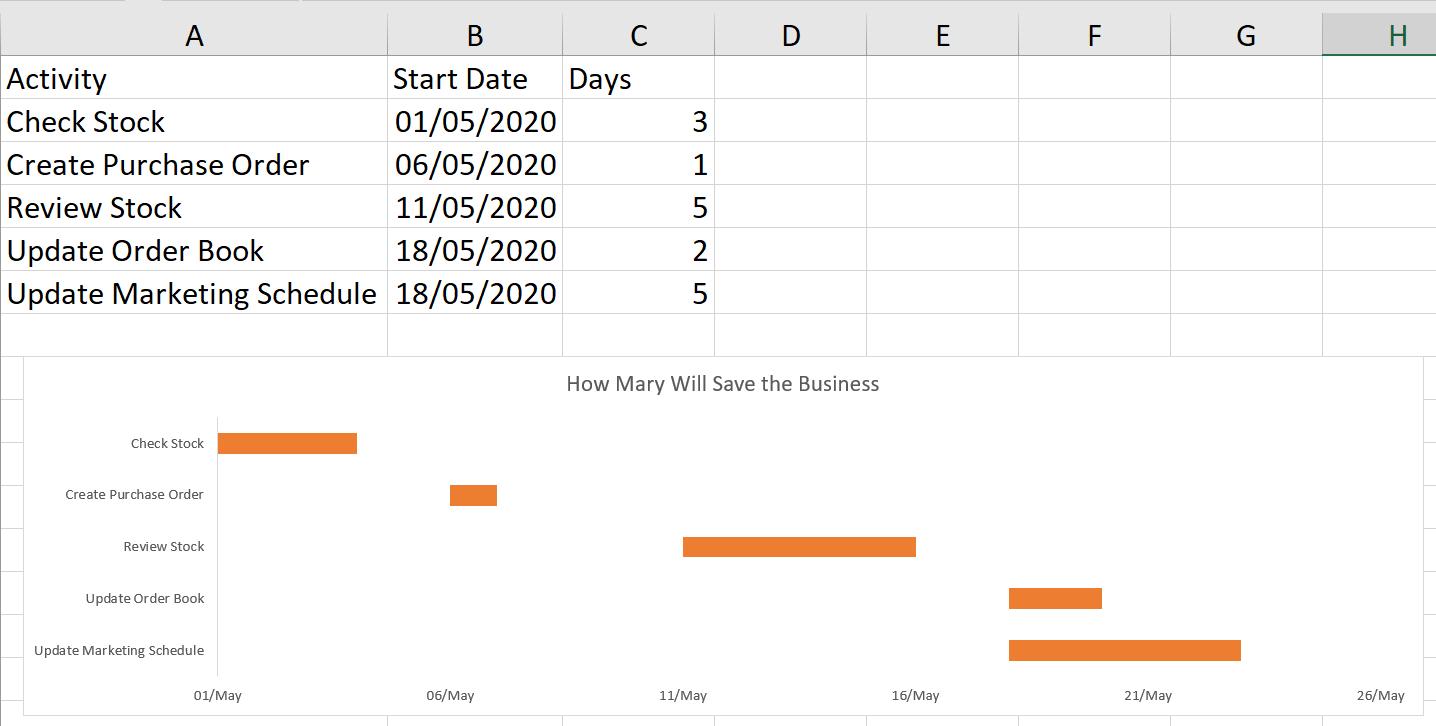
Charts and Dashboards: Great Gantt - Part 2

23 July 2021

Welcome back to our Charts and Dashboards blog series. This week, I format the Gantt chart created last week.


Charts and Dashboards: Great Gantt - Part 1

16 July 2021

Welcome back to our Charts and Dashboards blog series. This week, I look at how to create a Gantt chart.


Charts and Dashboards: Marking Milestones - Part 2

9 July 2021

Welcome back to our Charts and Dashboards blog series. This week, I continue to plot milestones on a timeline.


Charts and Dashboards: Marking Milestones - Part 1

2 July 2021

Welcome back to our Charts and Dashboards blog series. This week, I look at how to plot milestones on a timeline.


Newsletter