Please note javascript is required for full website functionality.

Charts And Dashboards Blogs

Charts And Dashboards Blogs

Charts and Dashboards: Chart Tools – Contextual Tabs (Part 2)

20 December 2019

Welcome back to Charts and Dashboards blog series. This week, we’ll continue to look at the Format sub-tab from the contextual Chart Tools tabs.


Charts and Dashboards: Chart Tools – Contextual Tabs (Part 1)

13 December 2019

Welcome back to Charts and Dashboards blog series. Over the next two weeks, we’ll look at contextual tabs in Chart Tools.


Charts and Dashboards: Chart Design Best Practice – Part 3: Memorable Charts

6 December 2019

Welcome back to Charts and Dashboards blog series. This week, we are going to look at some design concepts to adopt to create memorable charts.


Charts and Dashboards: Chart Design Best Practice – Part 2: Colours and Compositions

22 November 2019

Welcome back to Charts and Dashboards blog series. This week, we are going to look at colour and the variable aspects of a chart.


Charts and Dashboards: Chart Design Best Practice – Part 1: Which Chart When?

15 November 2019

Welcome back to our Charts and Dashboards blog series. Before moving on to working with charts, over the next three weeks, we will look at the best practice to create an effective chart. This week, we are going to have an overview of multiple chart types and which one to use when.


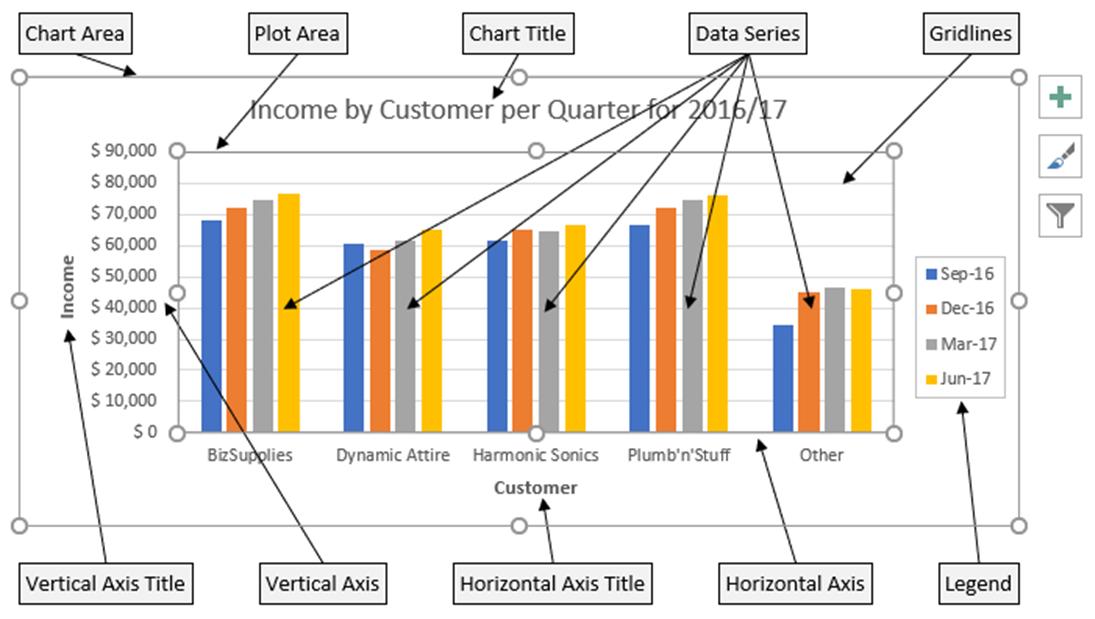
Charts and Dashboards: Understanding Chart Element

8 November 2019

Welcome back to Charts and Dashboards blog series. This week, we’ll go through all elements in a chart.


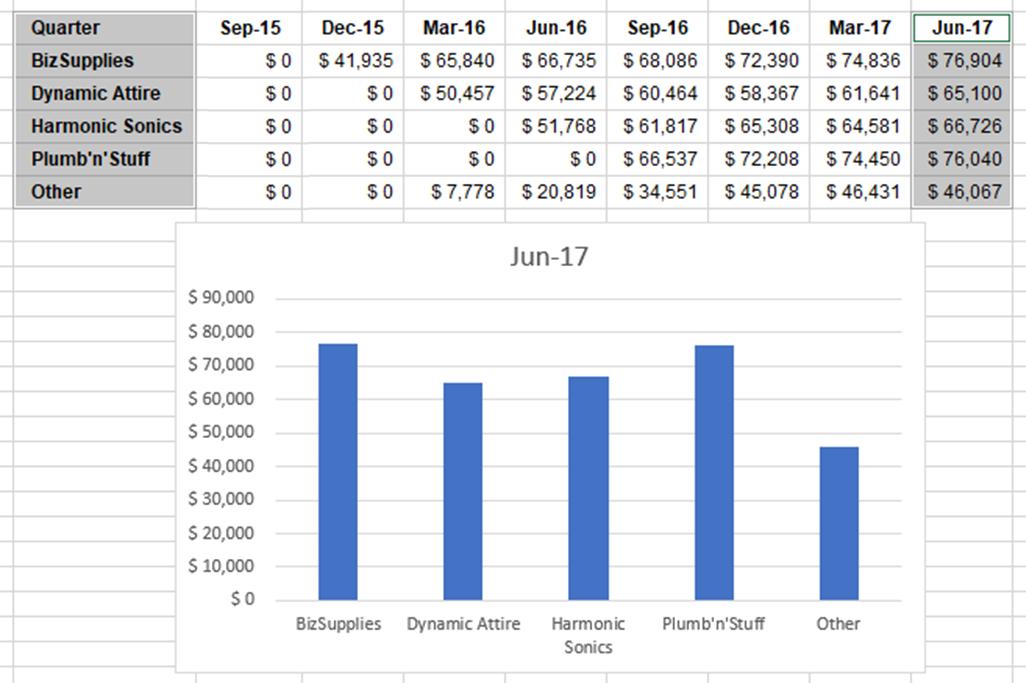
Charts and Dashboards: How to Create a Chart

1 November 2019

Welcome back to Charts and Dashboards blog series. This week, we’ll create our very first chart.


Charts and Dashboards: Getting to Know Charts in Excel

18 October 2019

Welcome to the very first post on Charts and Dashboards blog series. As a fresh start, let’s get to know about Charts and Dashboards in Excel.


Newsletter