
Charts And Dashboards Blogs
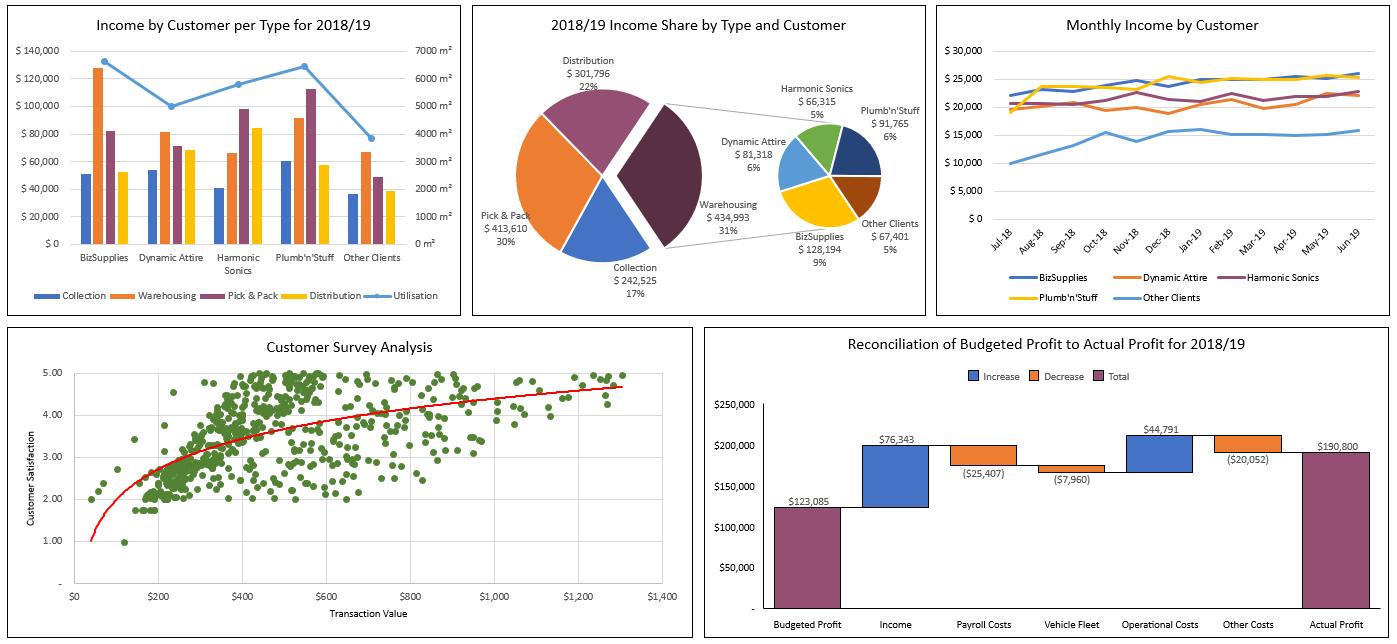
Charts and Dashboards: Dashboard Workbook Layout – Part 2
11 September 2020
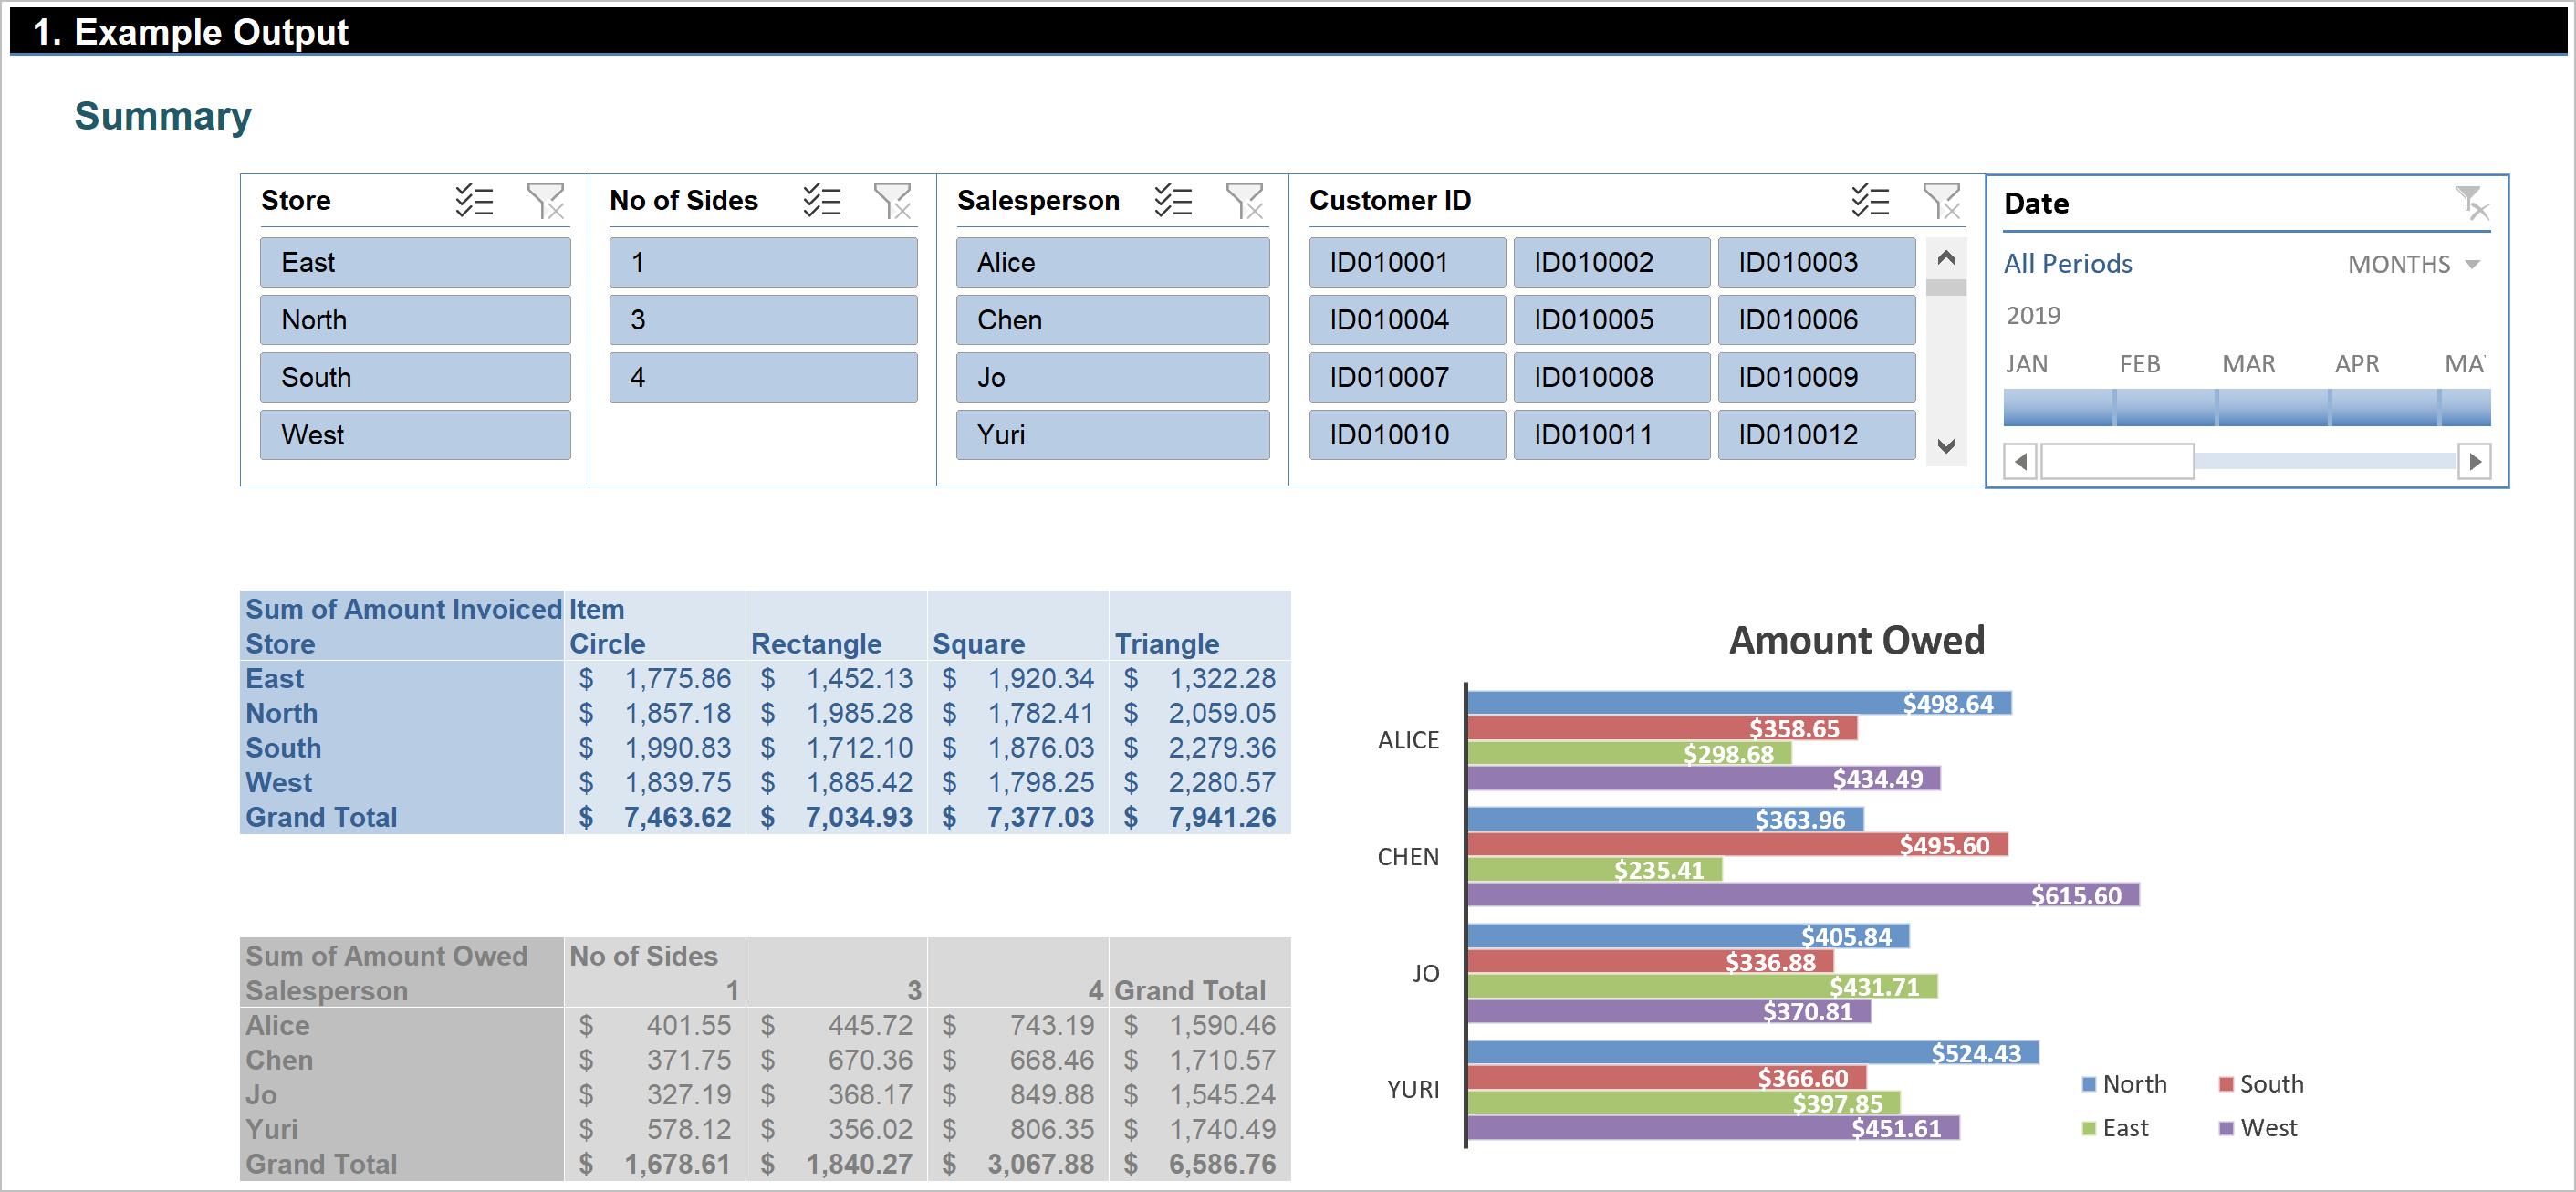
Charts and Dashboards: Dashboard Workbook Layout – Part 1
4 September 2020

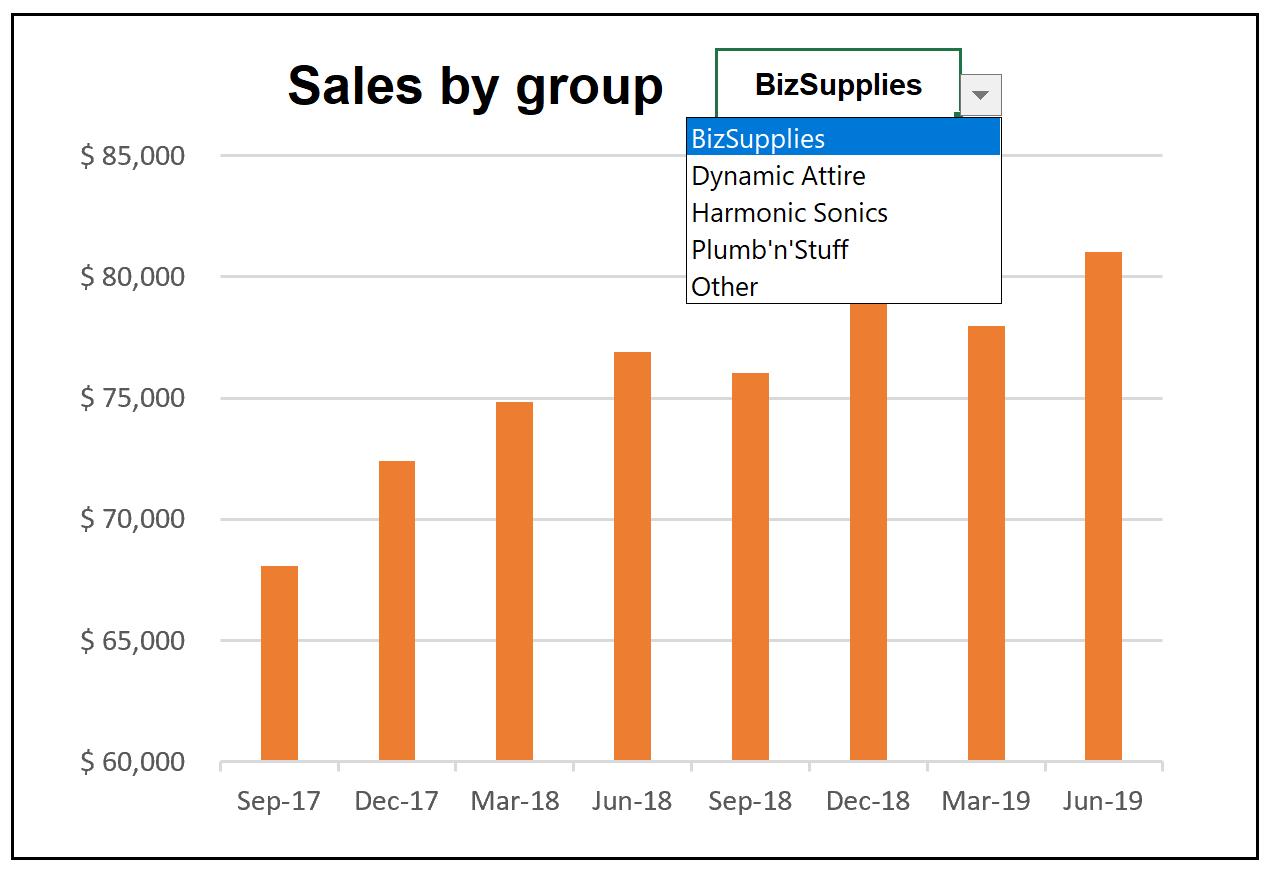
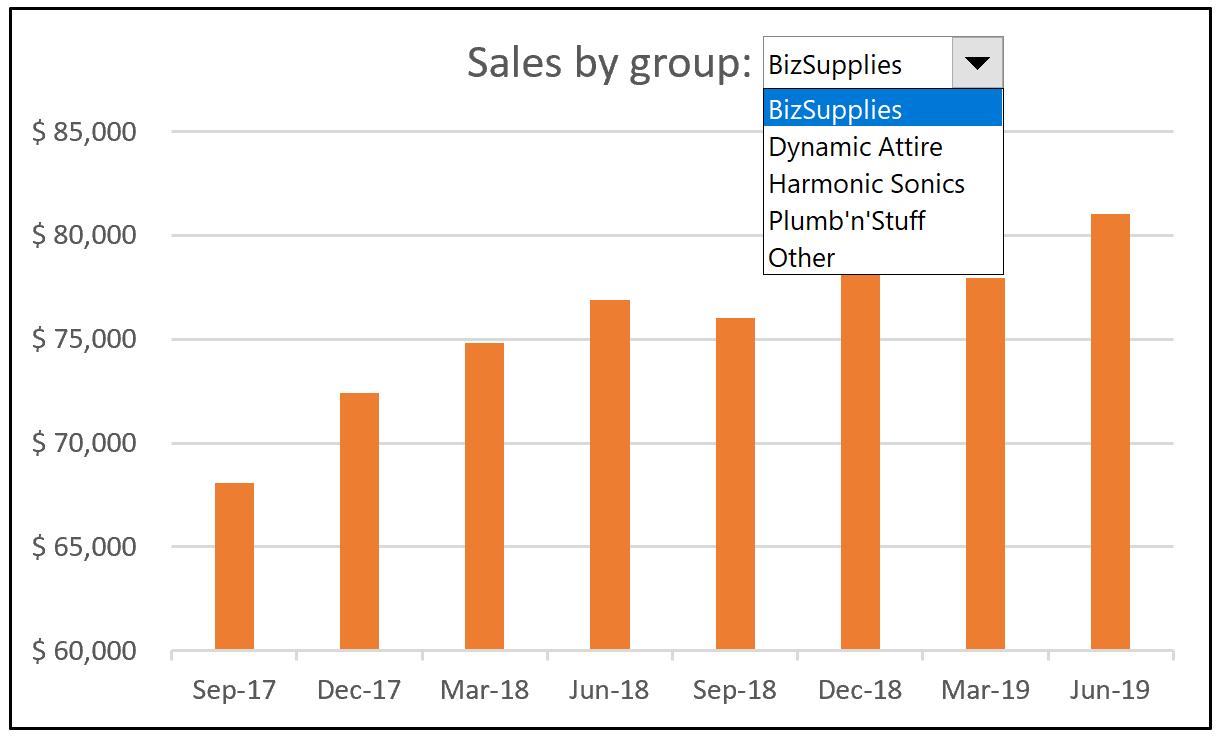
Charts and Dashboards: Dynamic Charts – Part 3
17 July 2020
Charts and Dashboards: Dynamic Charts – Part 2
10 July 2020
Charts and Dashboards: Dynamic Charts – Part 1
3 July 2020
Charts and Dashboards: Hiding Data - Part 2
19 June 2020