
Charts and Dashboards: Hiding Data - Part 2
19 June 2020
Welcome back to this week’s Charts and Dashboards blog series. This week, we’ll continue to talk about how to hide chart data.
Last week, we talked about chart data with missing values and different ways to hide these ‘blanks’ on charts. This week, we’ll discuss some tips and tricks related to hiding data in general.
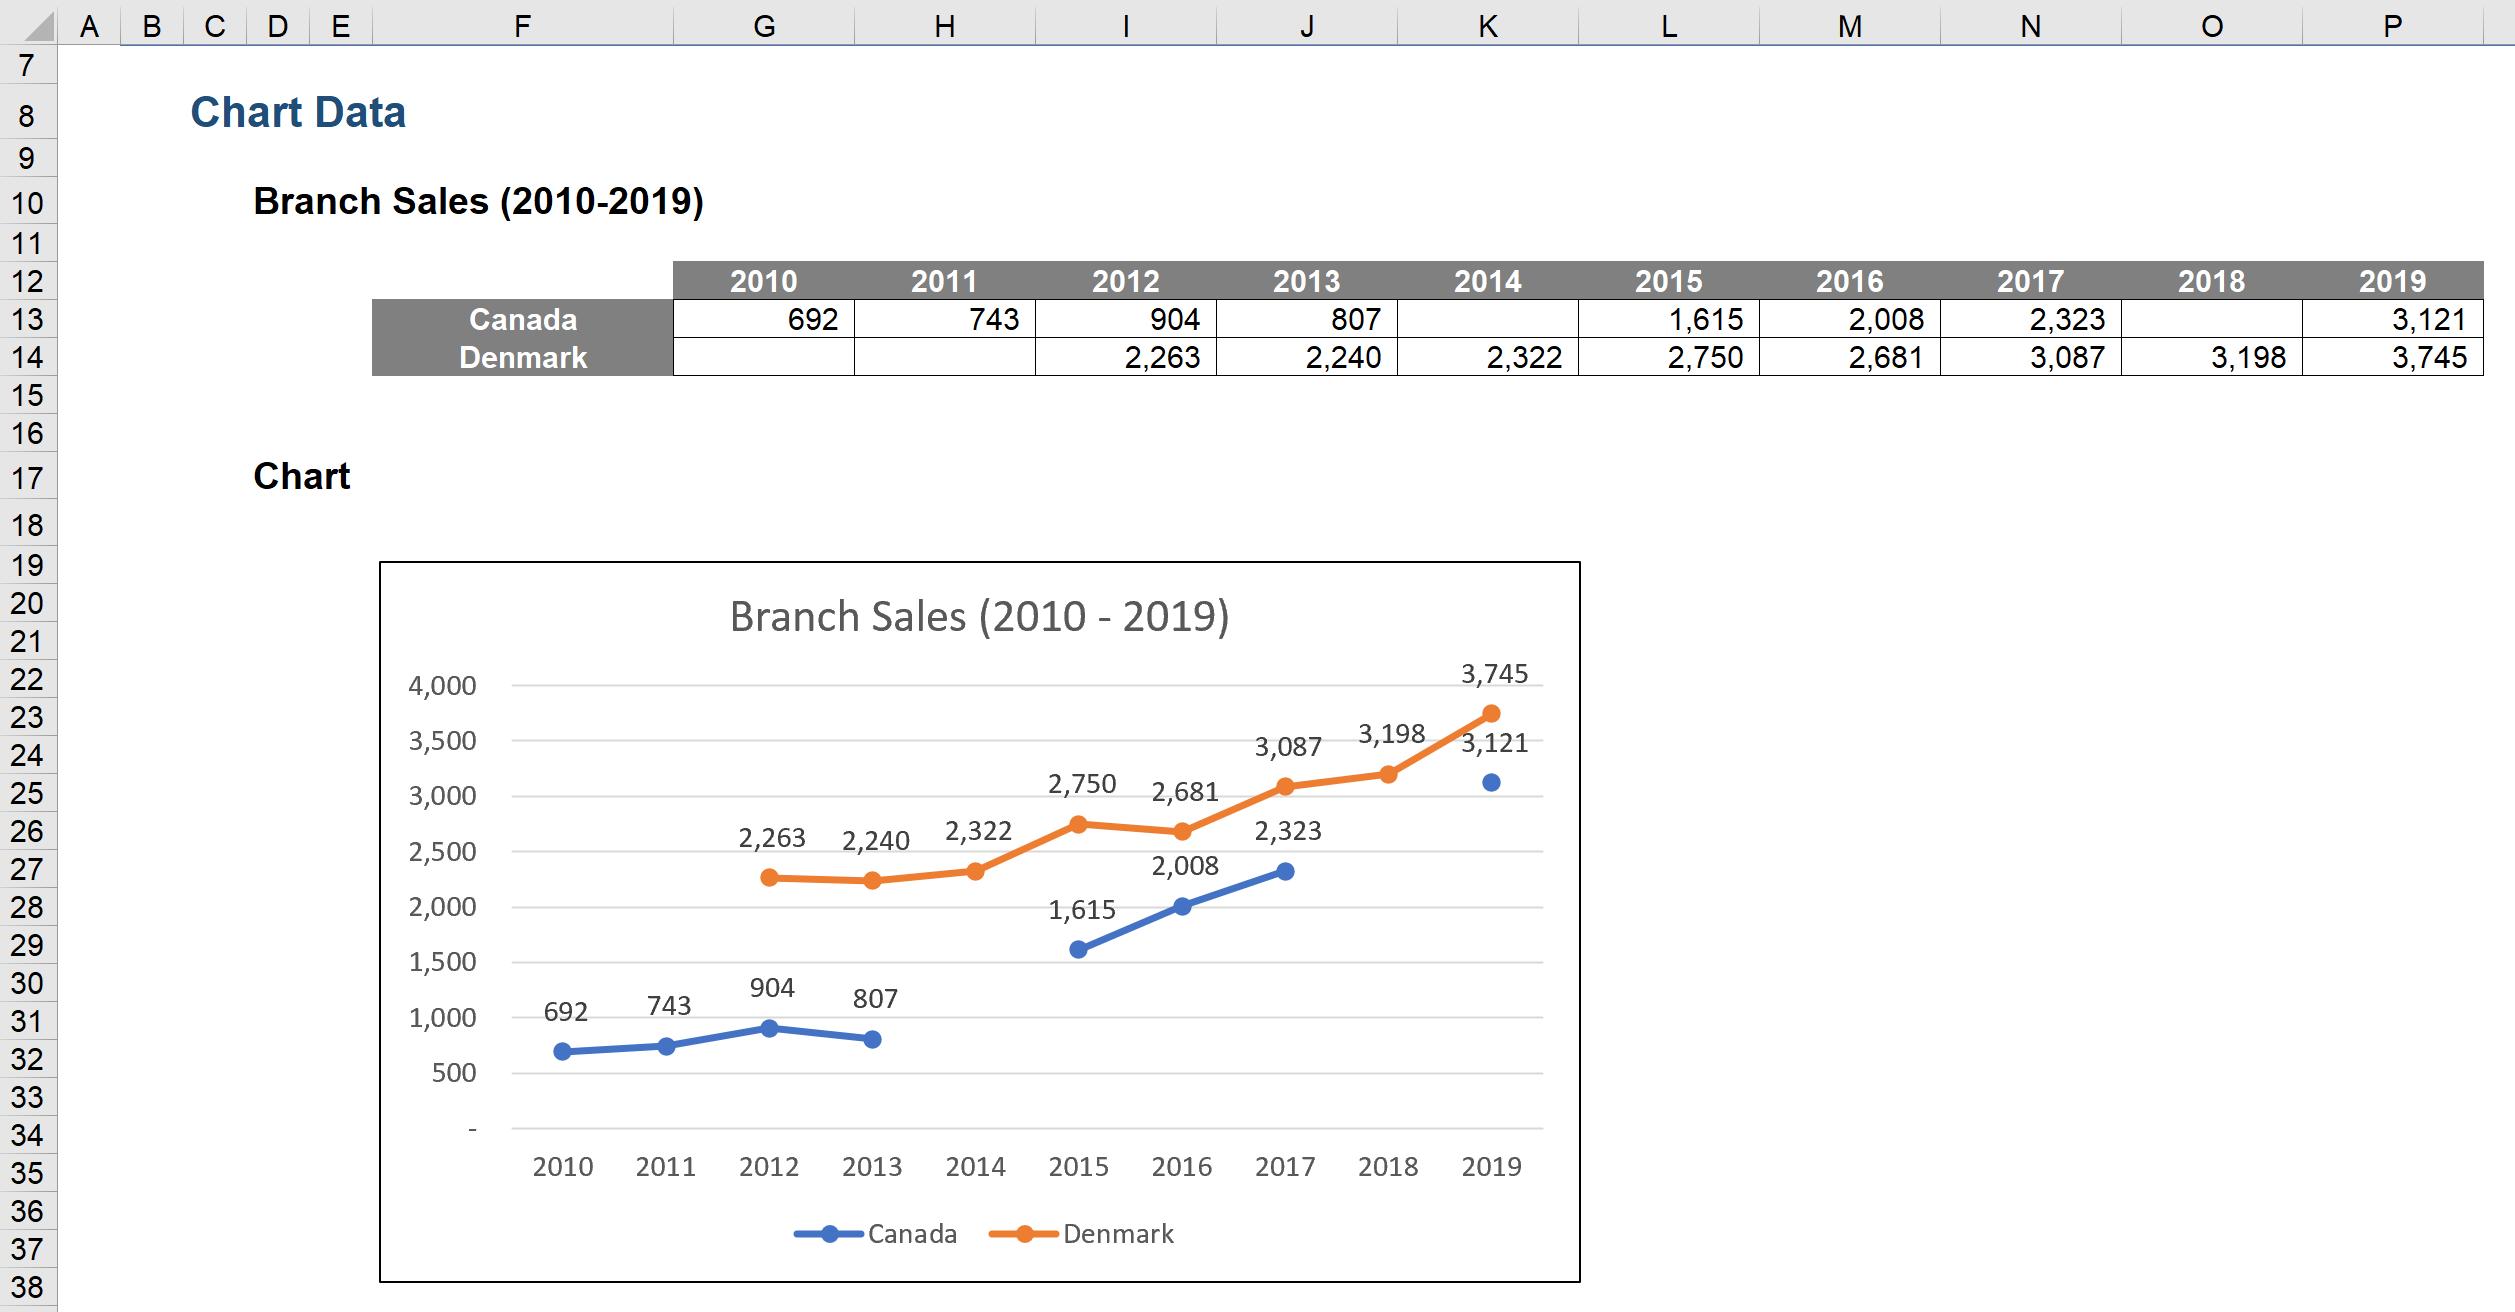
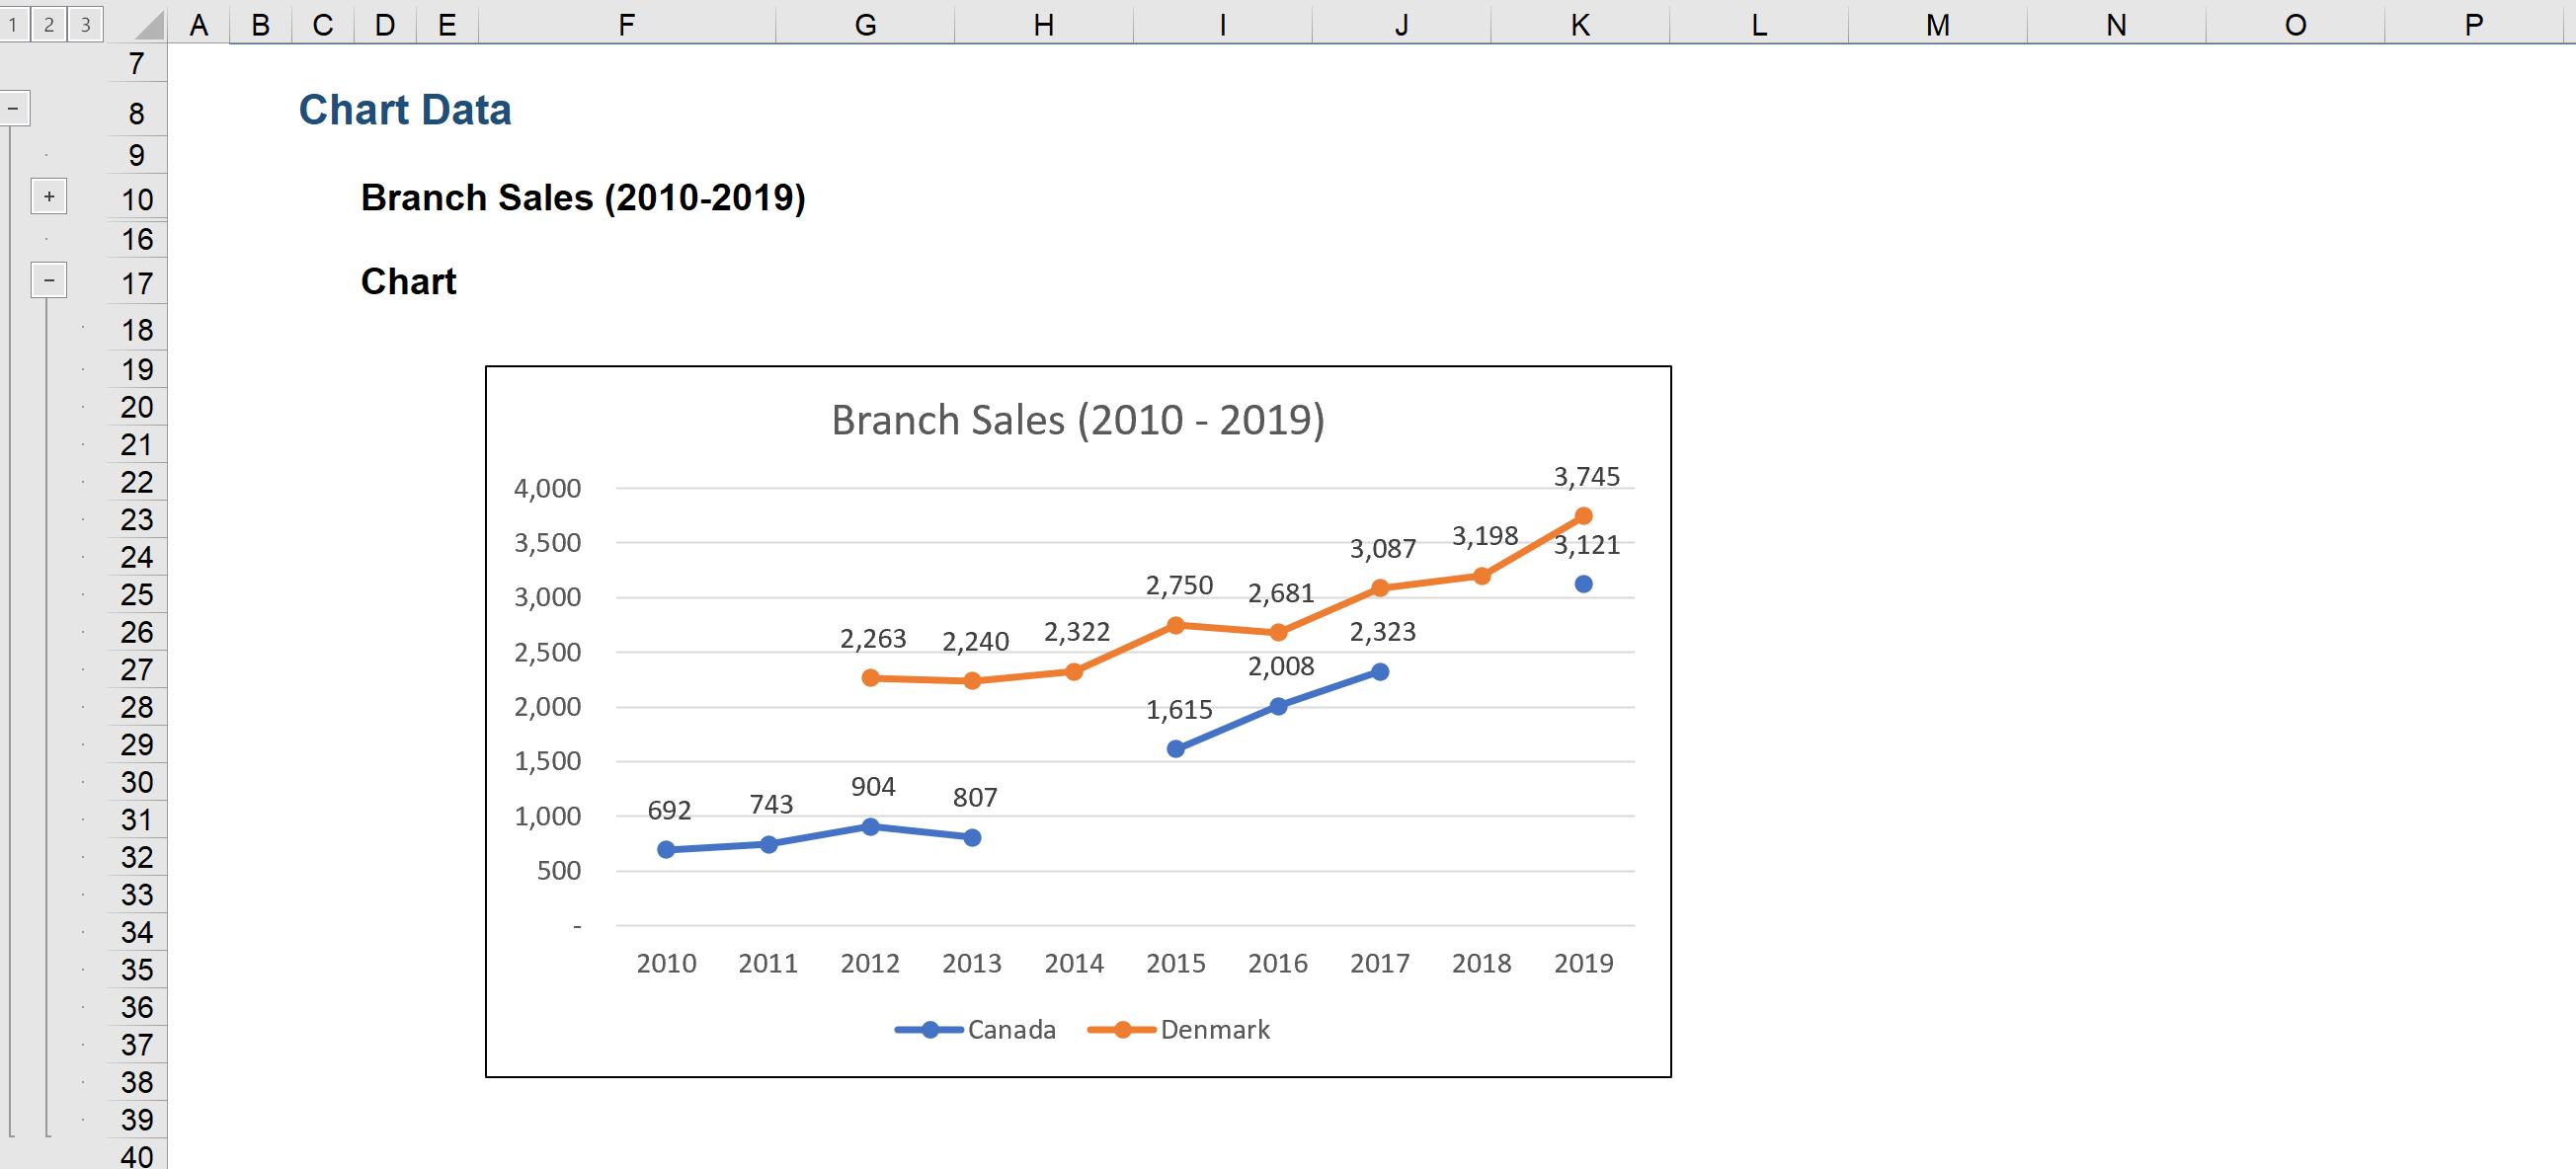
For example, imagine we have sales data as below, with some missing data, and we present those missing points in the chart as gaps, viz.
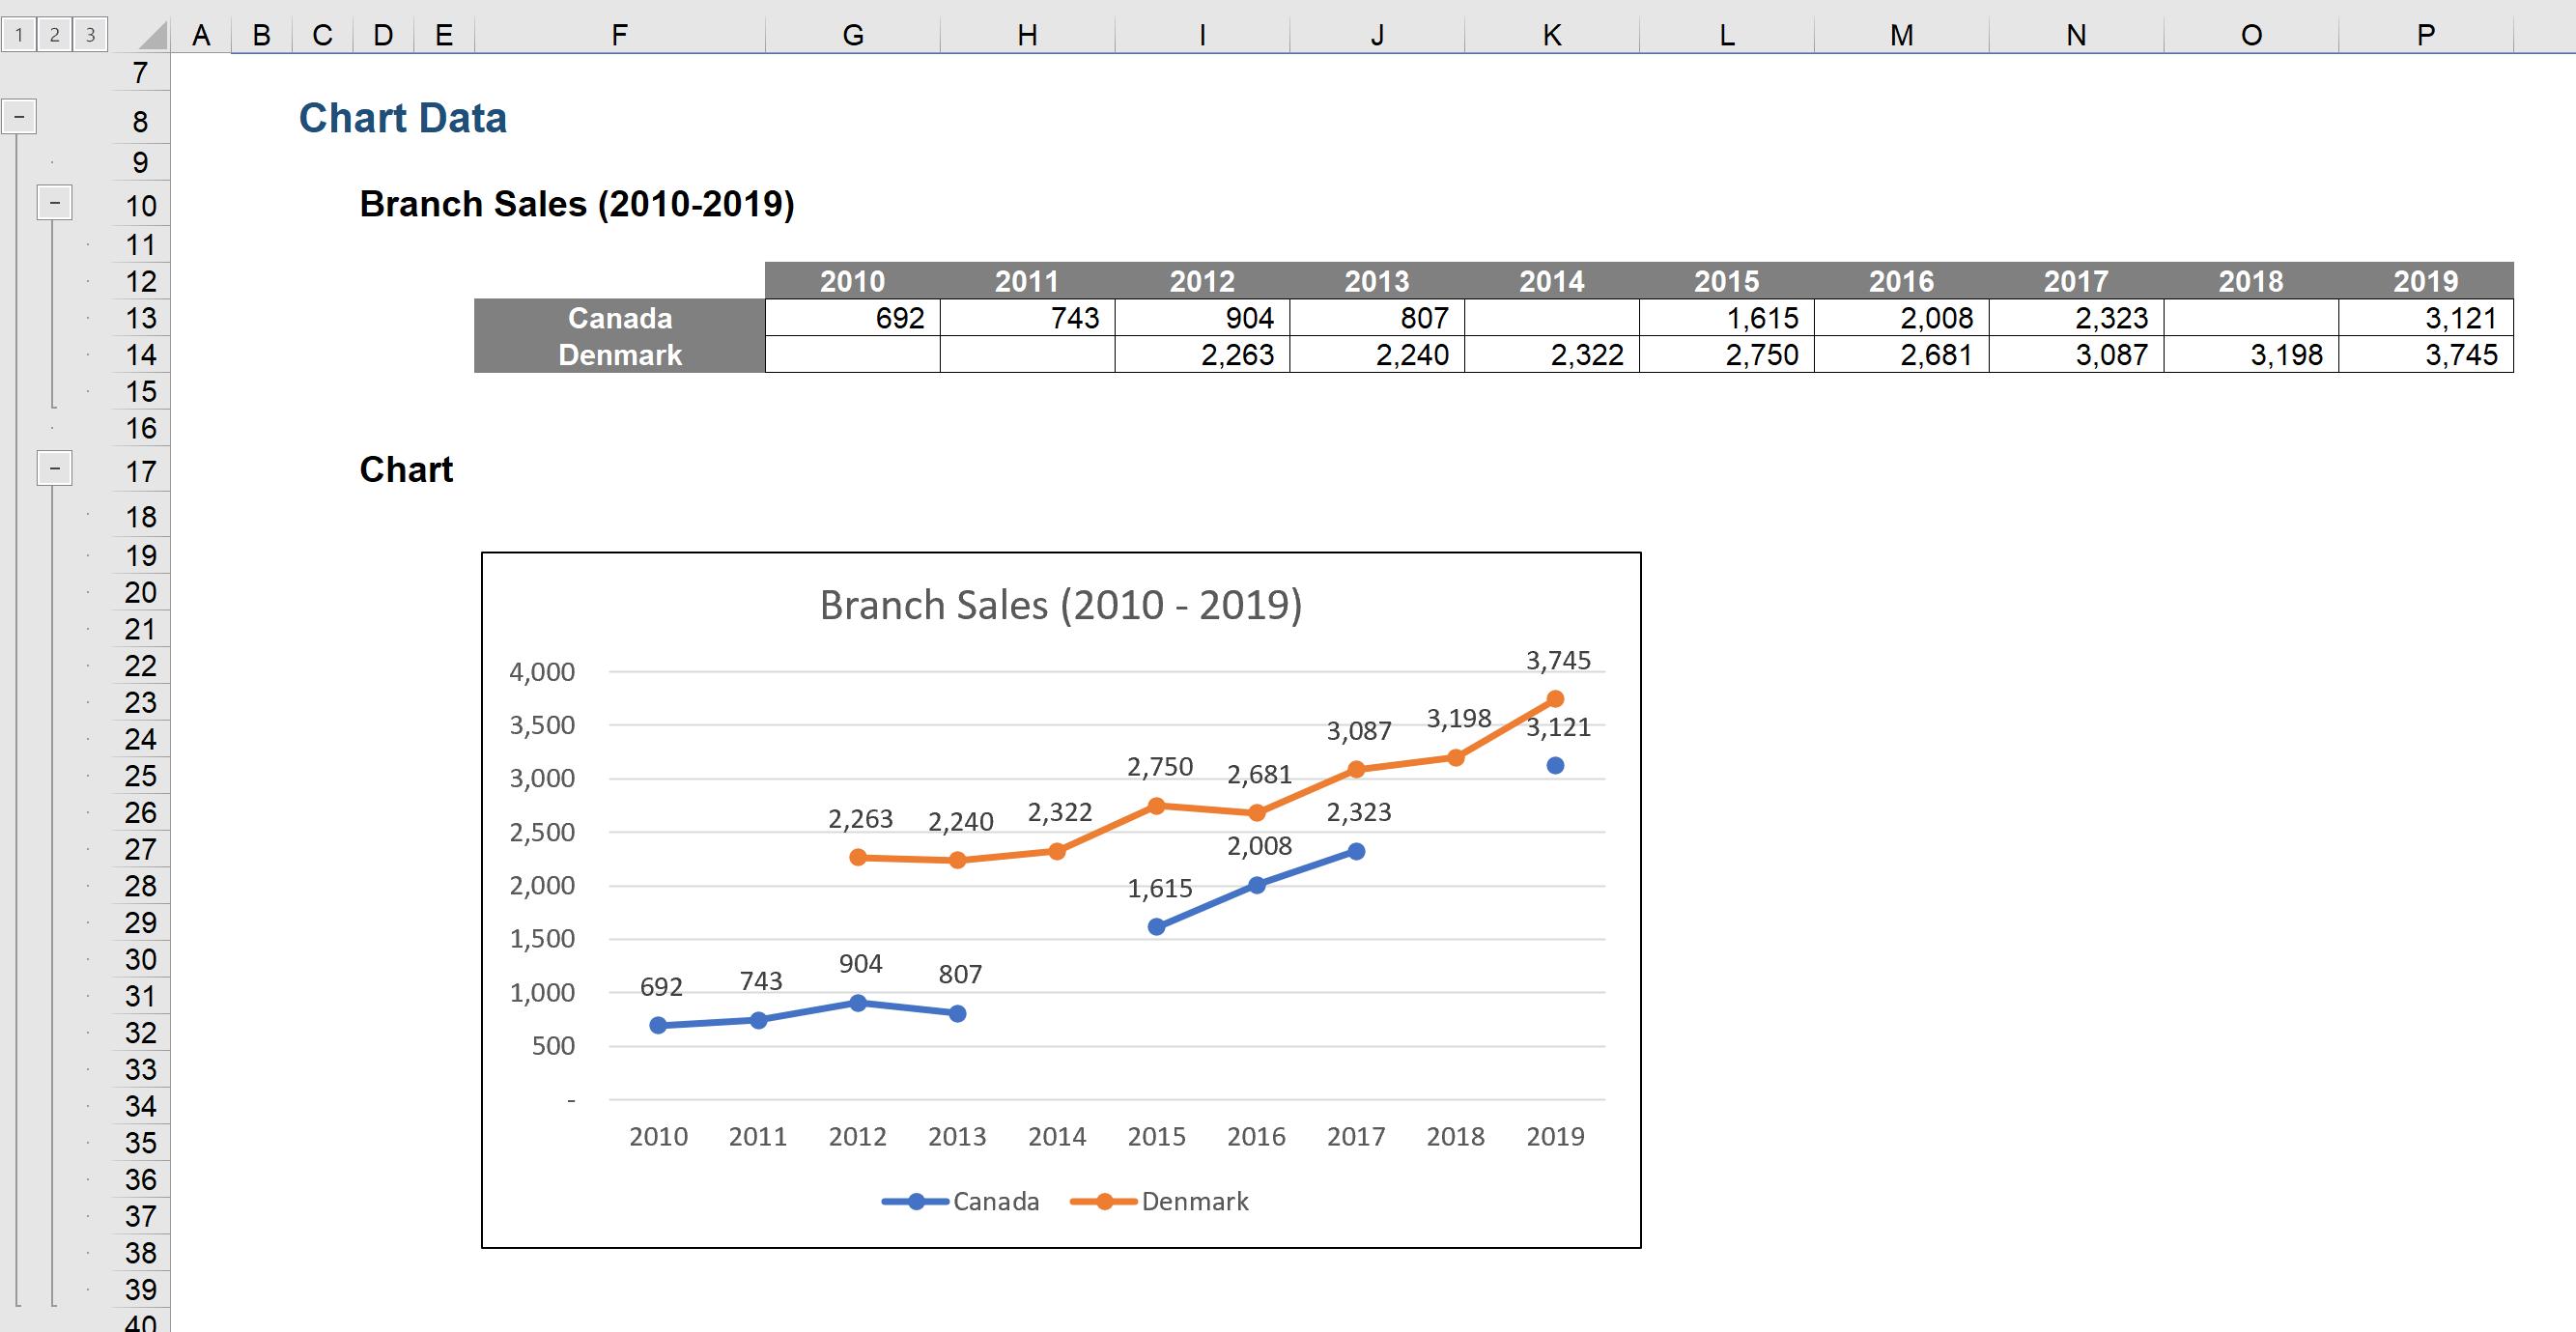
To better lay out our dashboard, we wish to group our data and chart in separate sections, by highlighting the rows we want to group, navigating to the Data tab on the Ribbon and clicking Group, or else ALT + A + G + G:
When we hide our data in order to show just the chart … oops … where is the chart!?
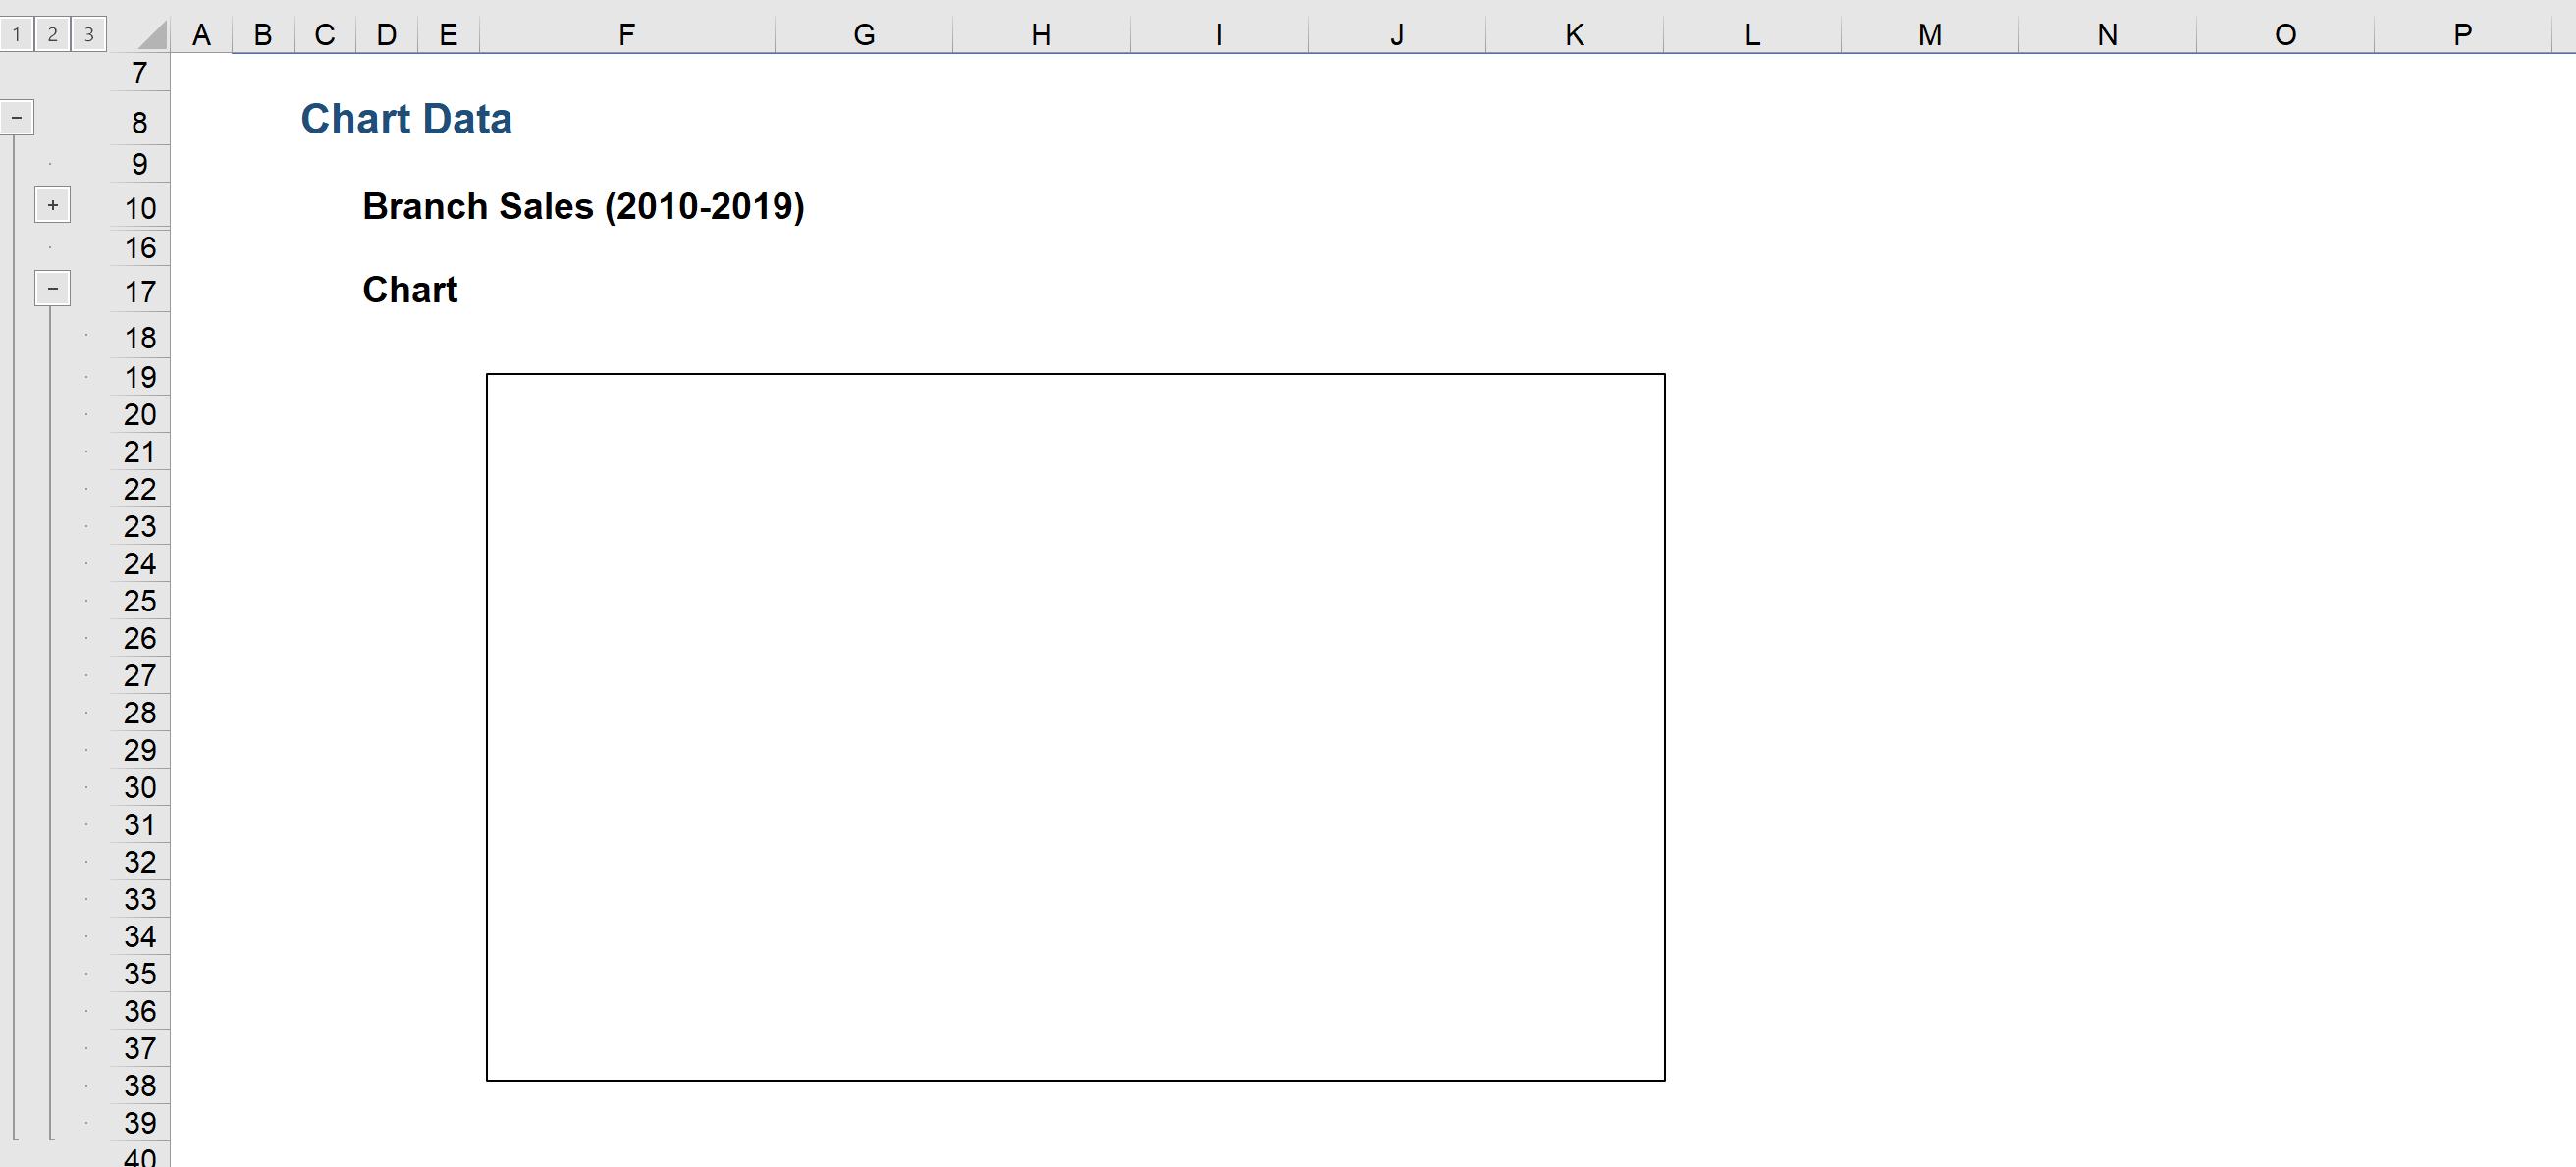
…The chart is hidden as we have hidden the grouped rows relating to the chart data!
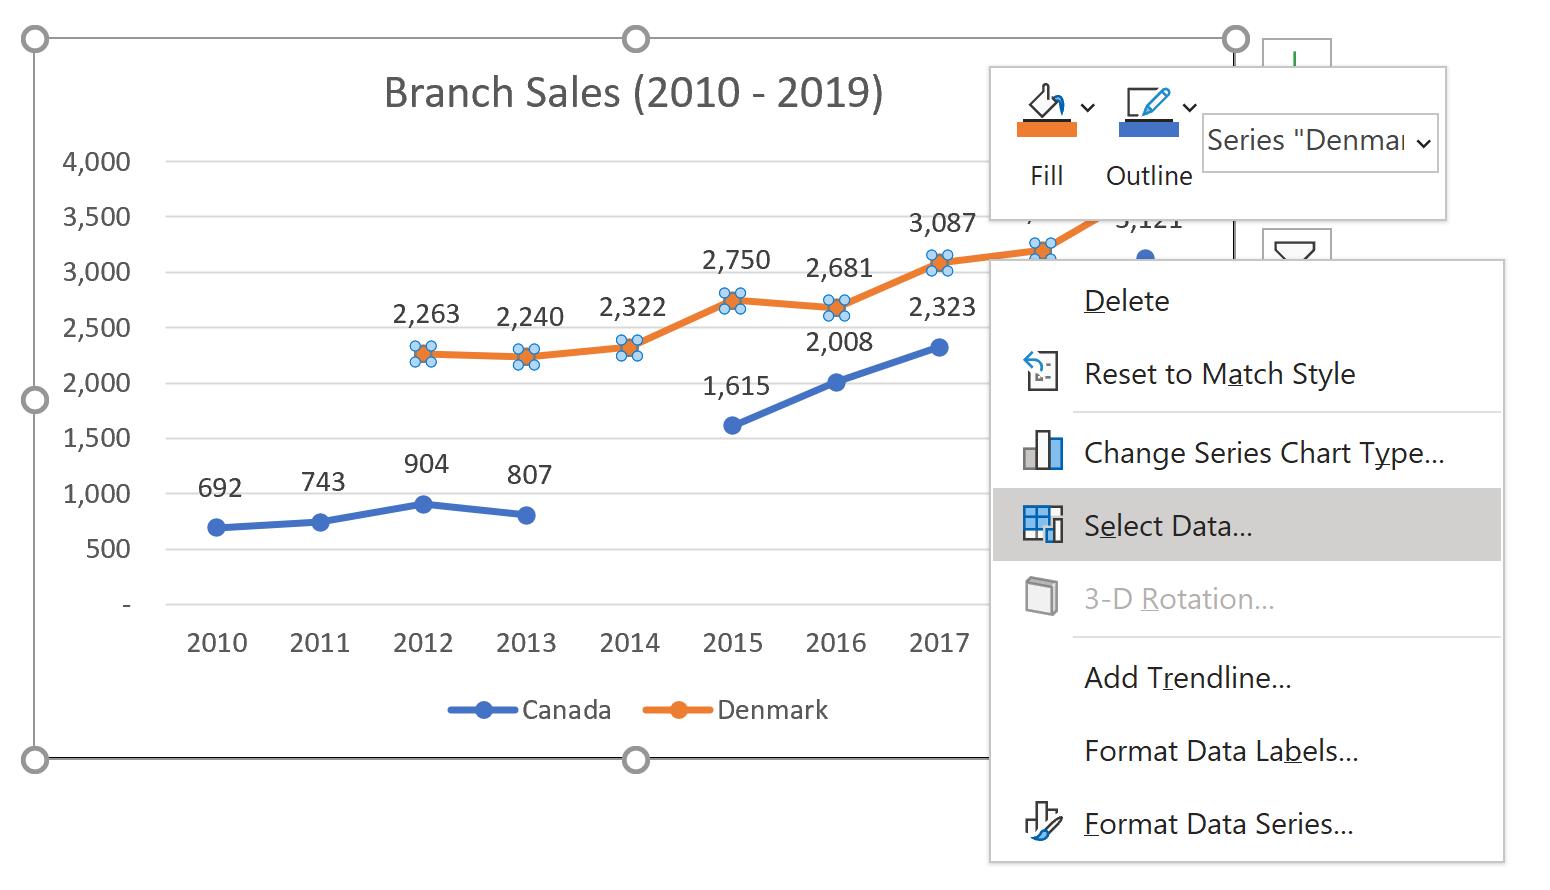
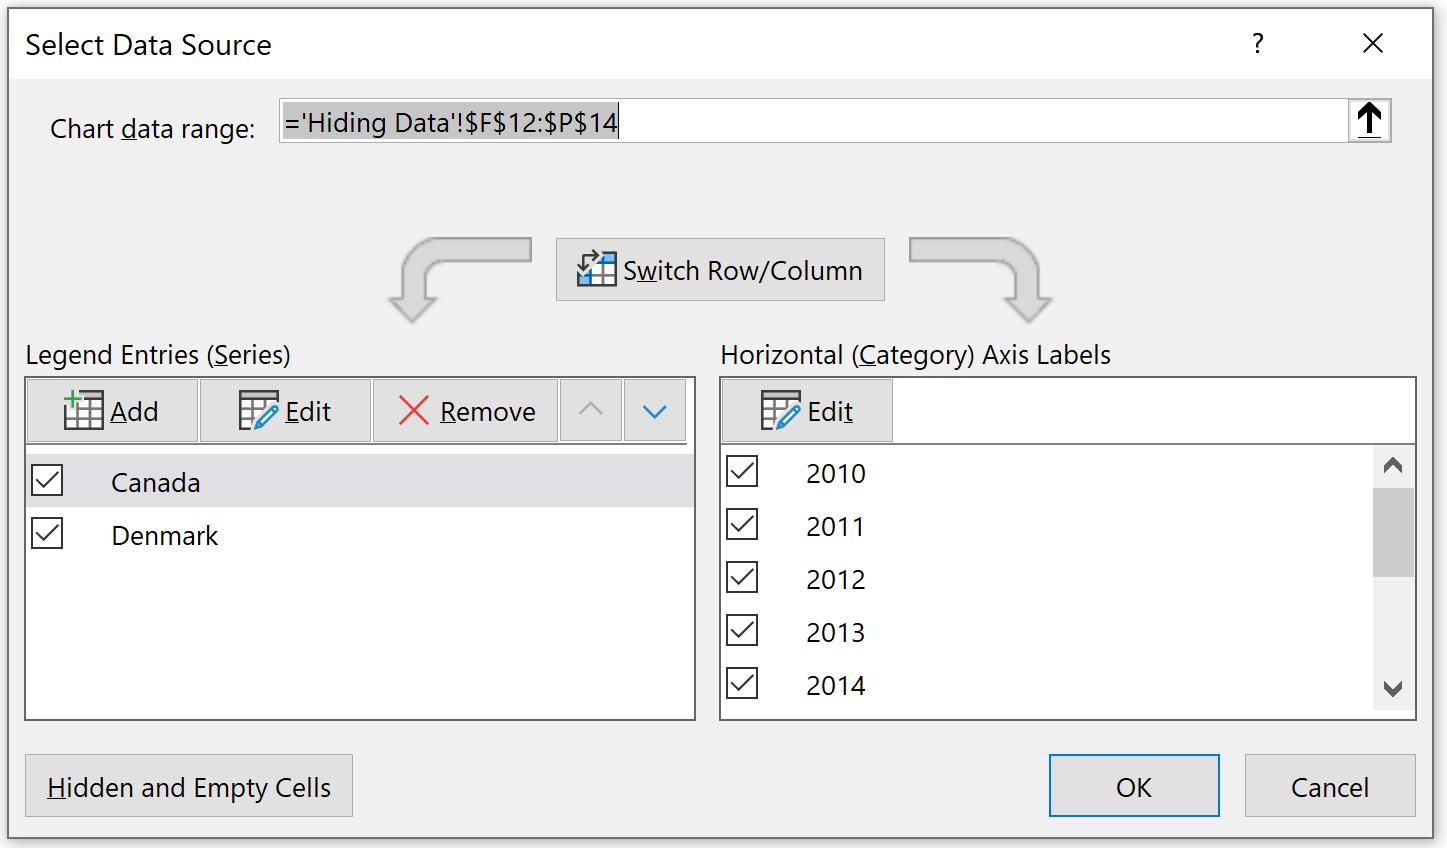
To fix this, open the grouped rows (so that we may see the chart), then right-click on the data series and choose ‘Select Data…’:
The ‘Select Data Source’ dialog will appear. In here, go to the ‘Hidden and Empty Cells’ in the left-hand bottom corner:
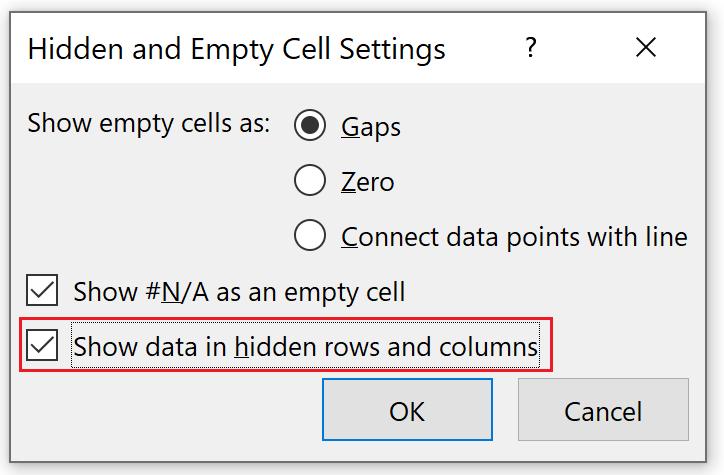
In the ‘Hidden and Empty Cell Settings’ pop-up dialog, make sure the ‘Show data in hidden rows and columns’ box is ticked:
Now, if we hide the group rows, the chart is still displayed nicely:
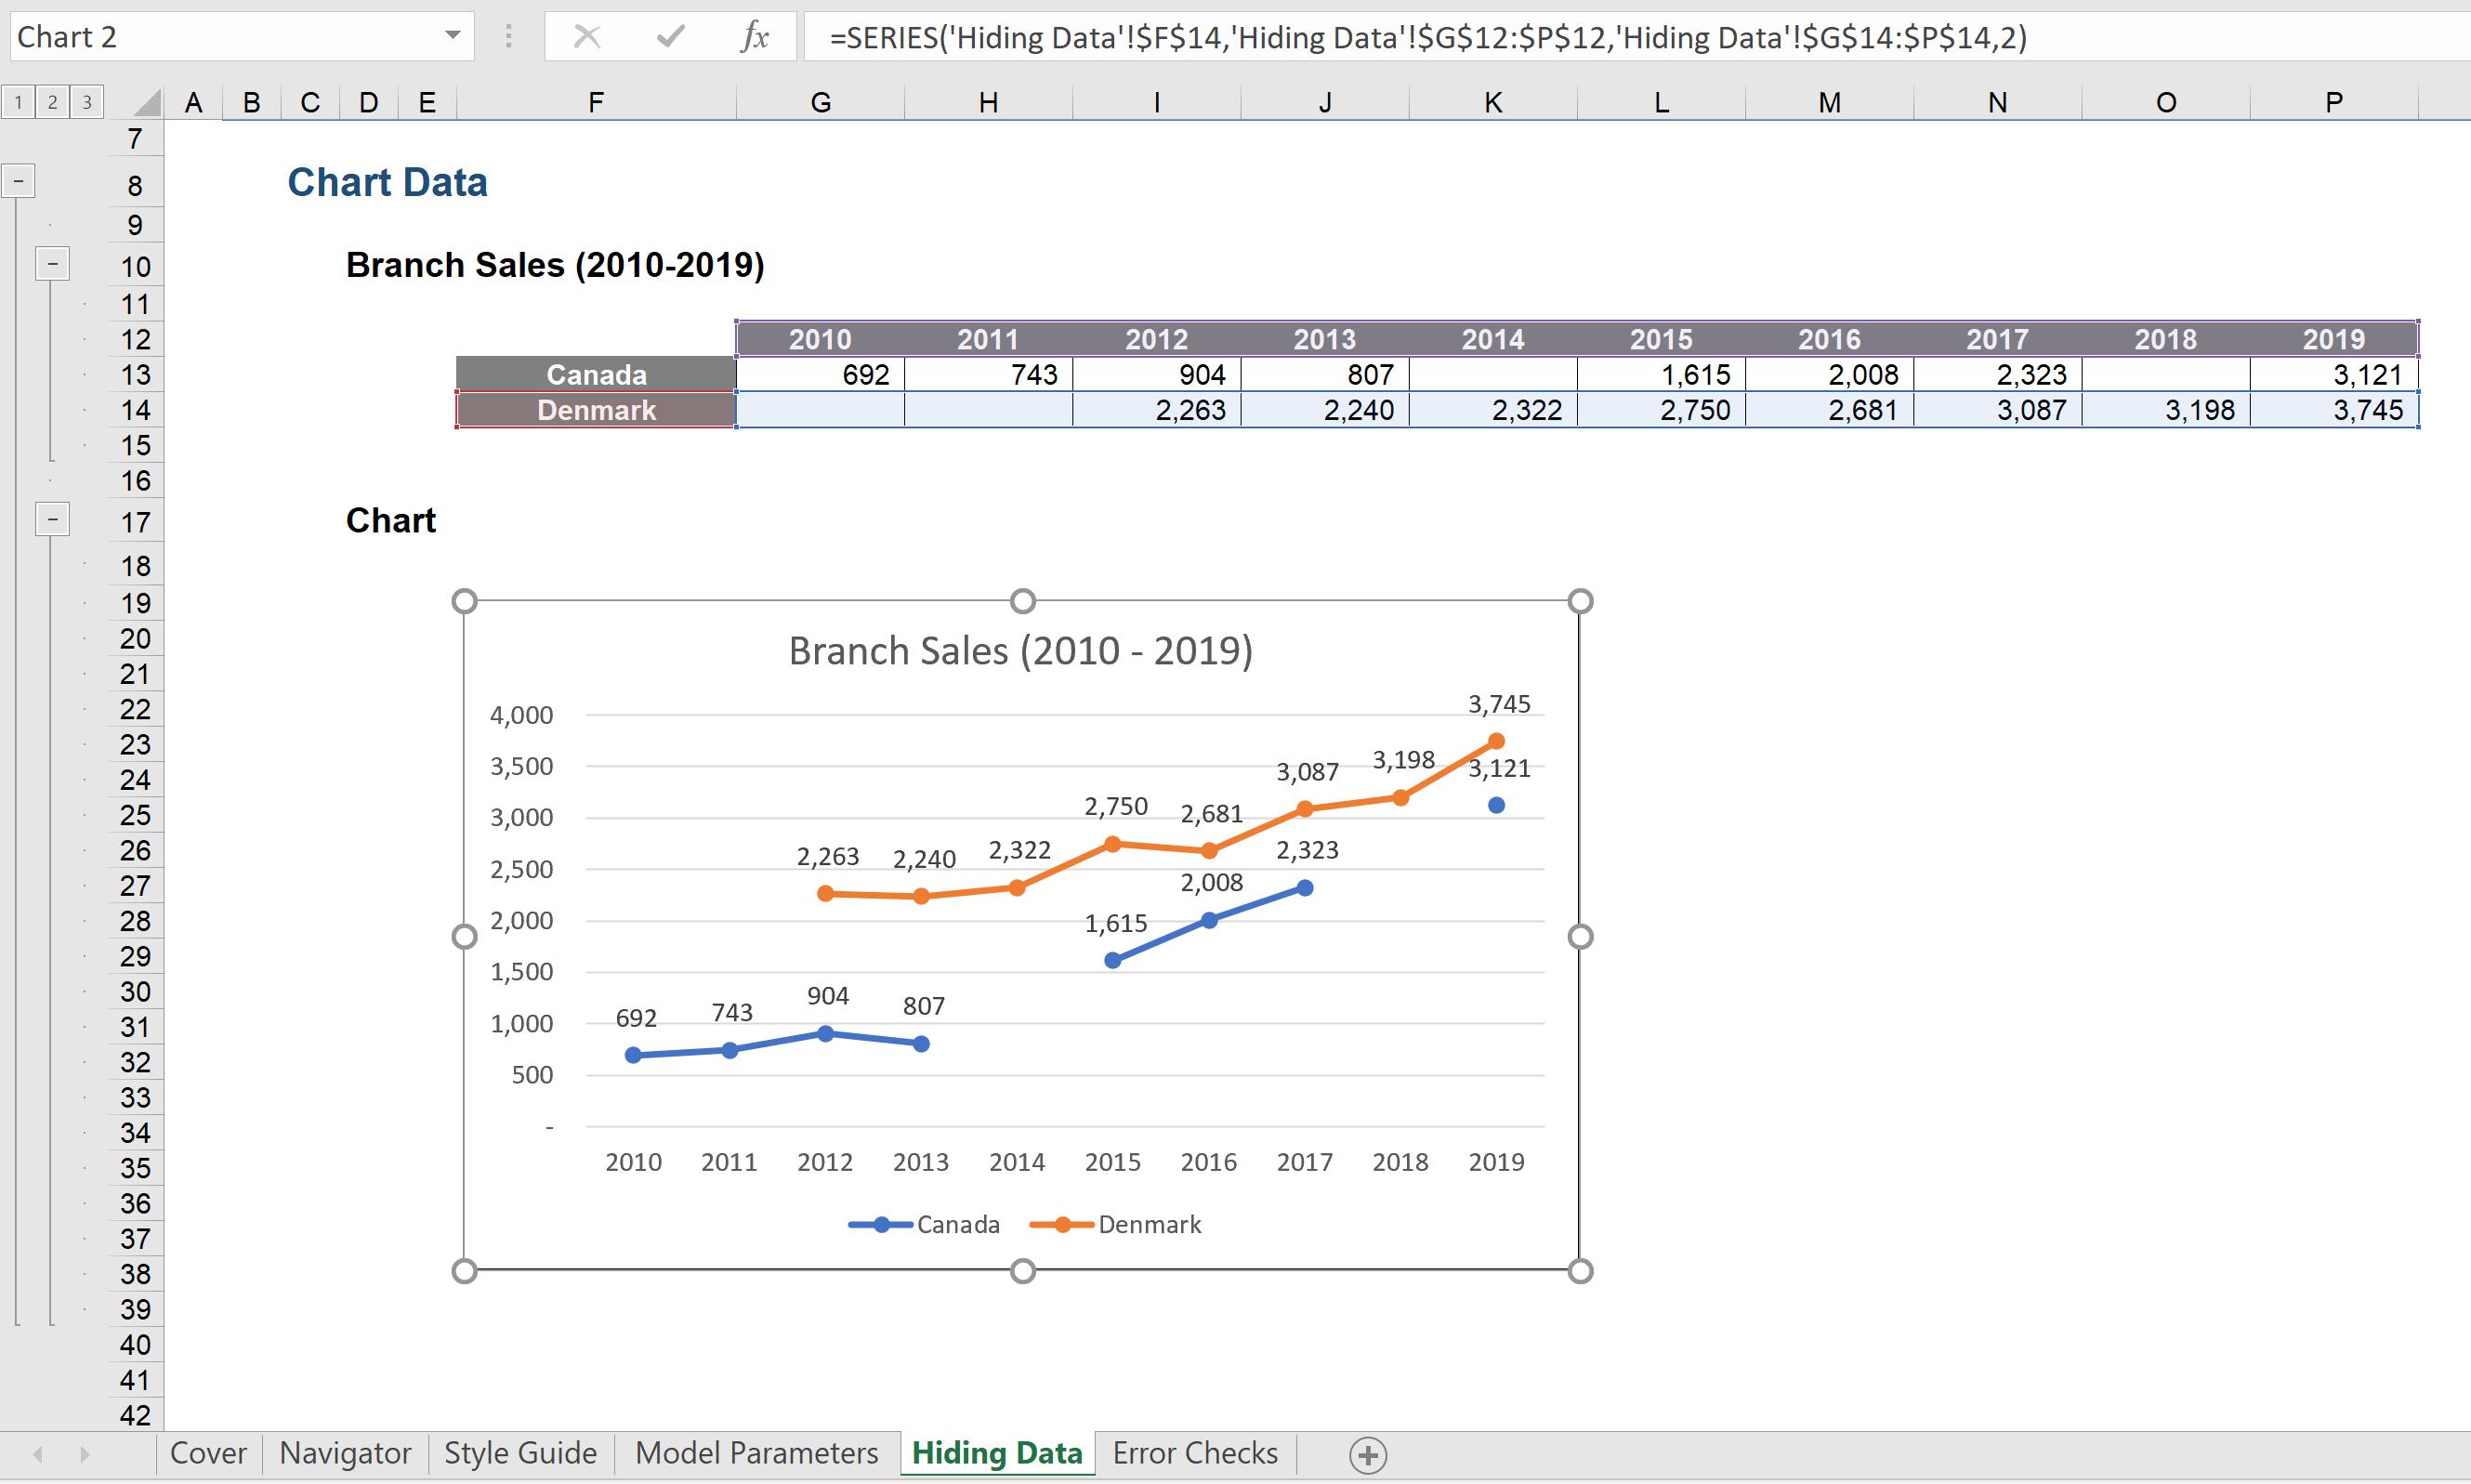
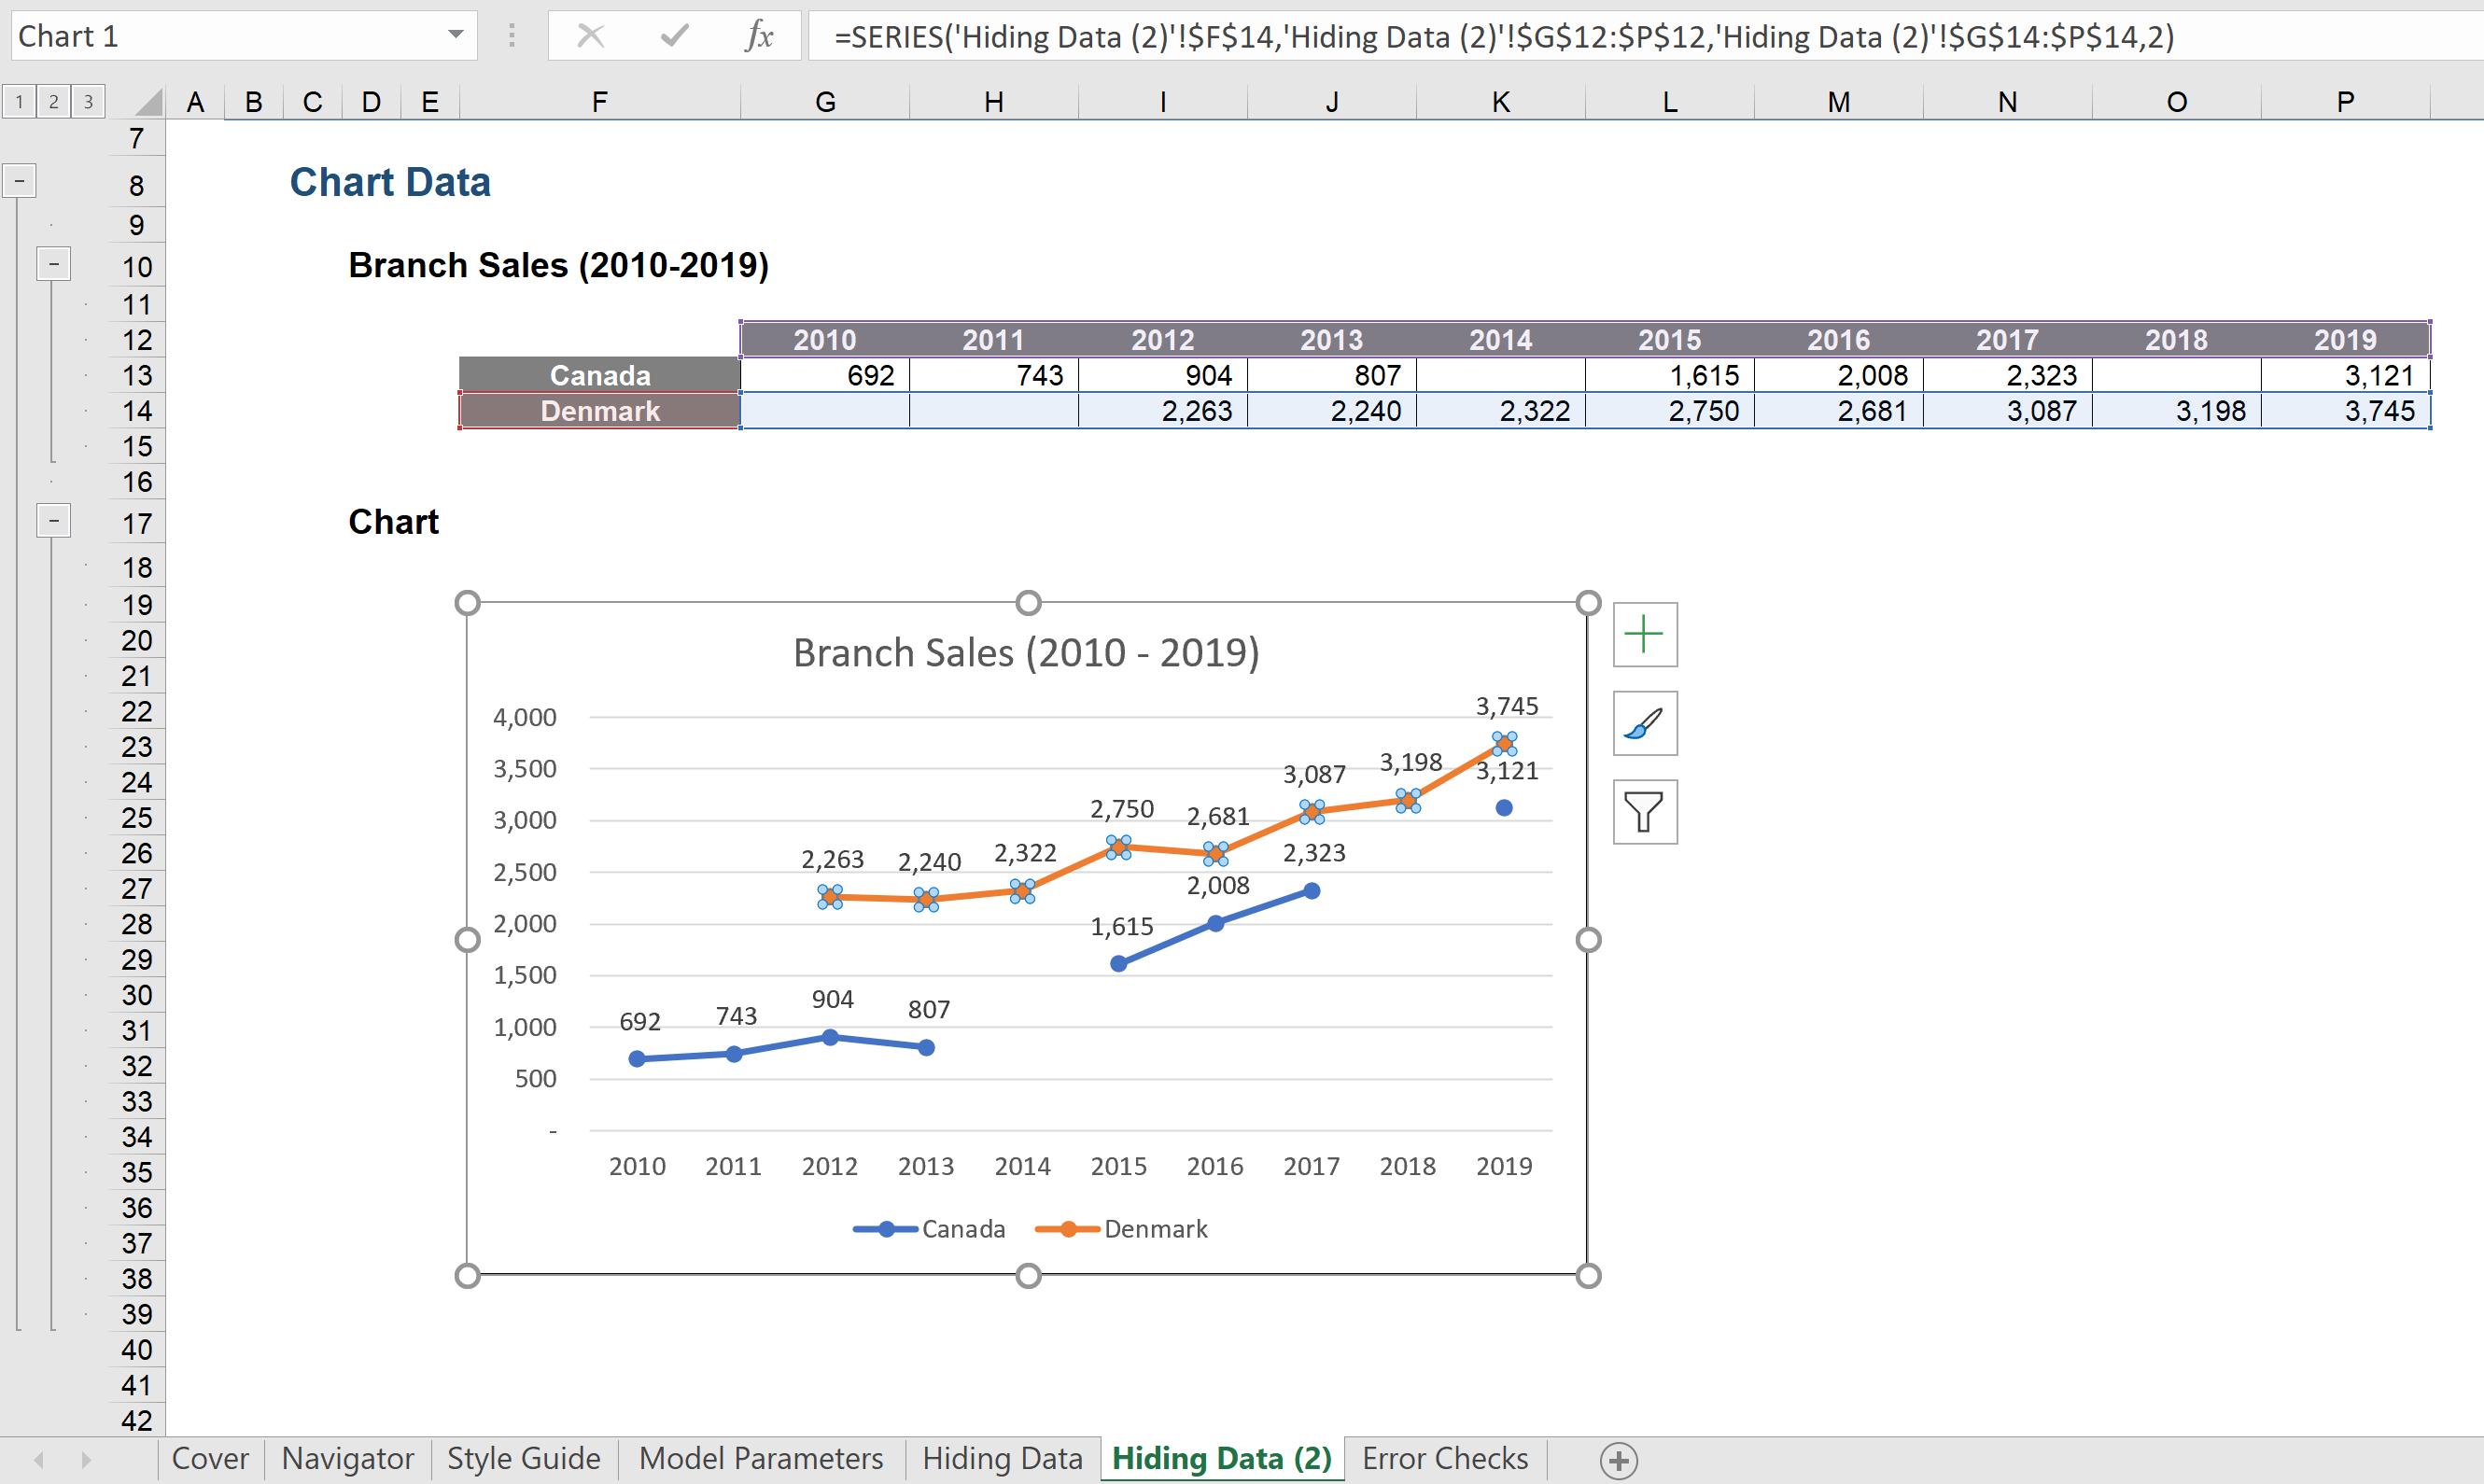
One more tip that I’d like to mention here is the reason why we should put our chart in the same sheet as its linked data. If we click on the chart series, we’ll see where the data series is:
If we copy the whole worksheet, the chart in the new worksheet, ‘Hiding Data (2)’, has its data series map to the data in the same sheet, which is clear:
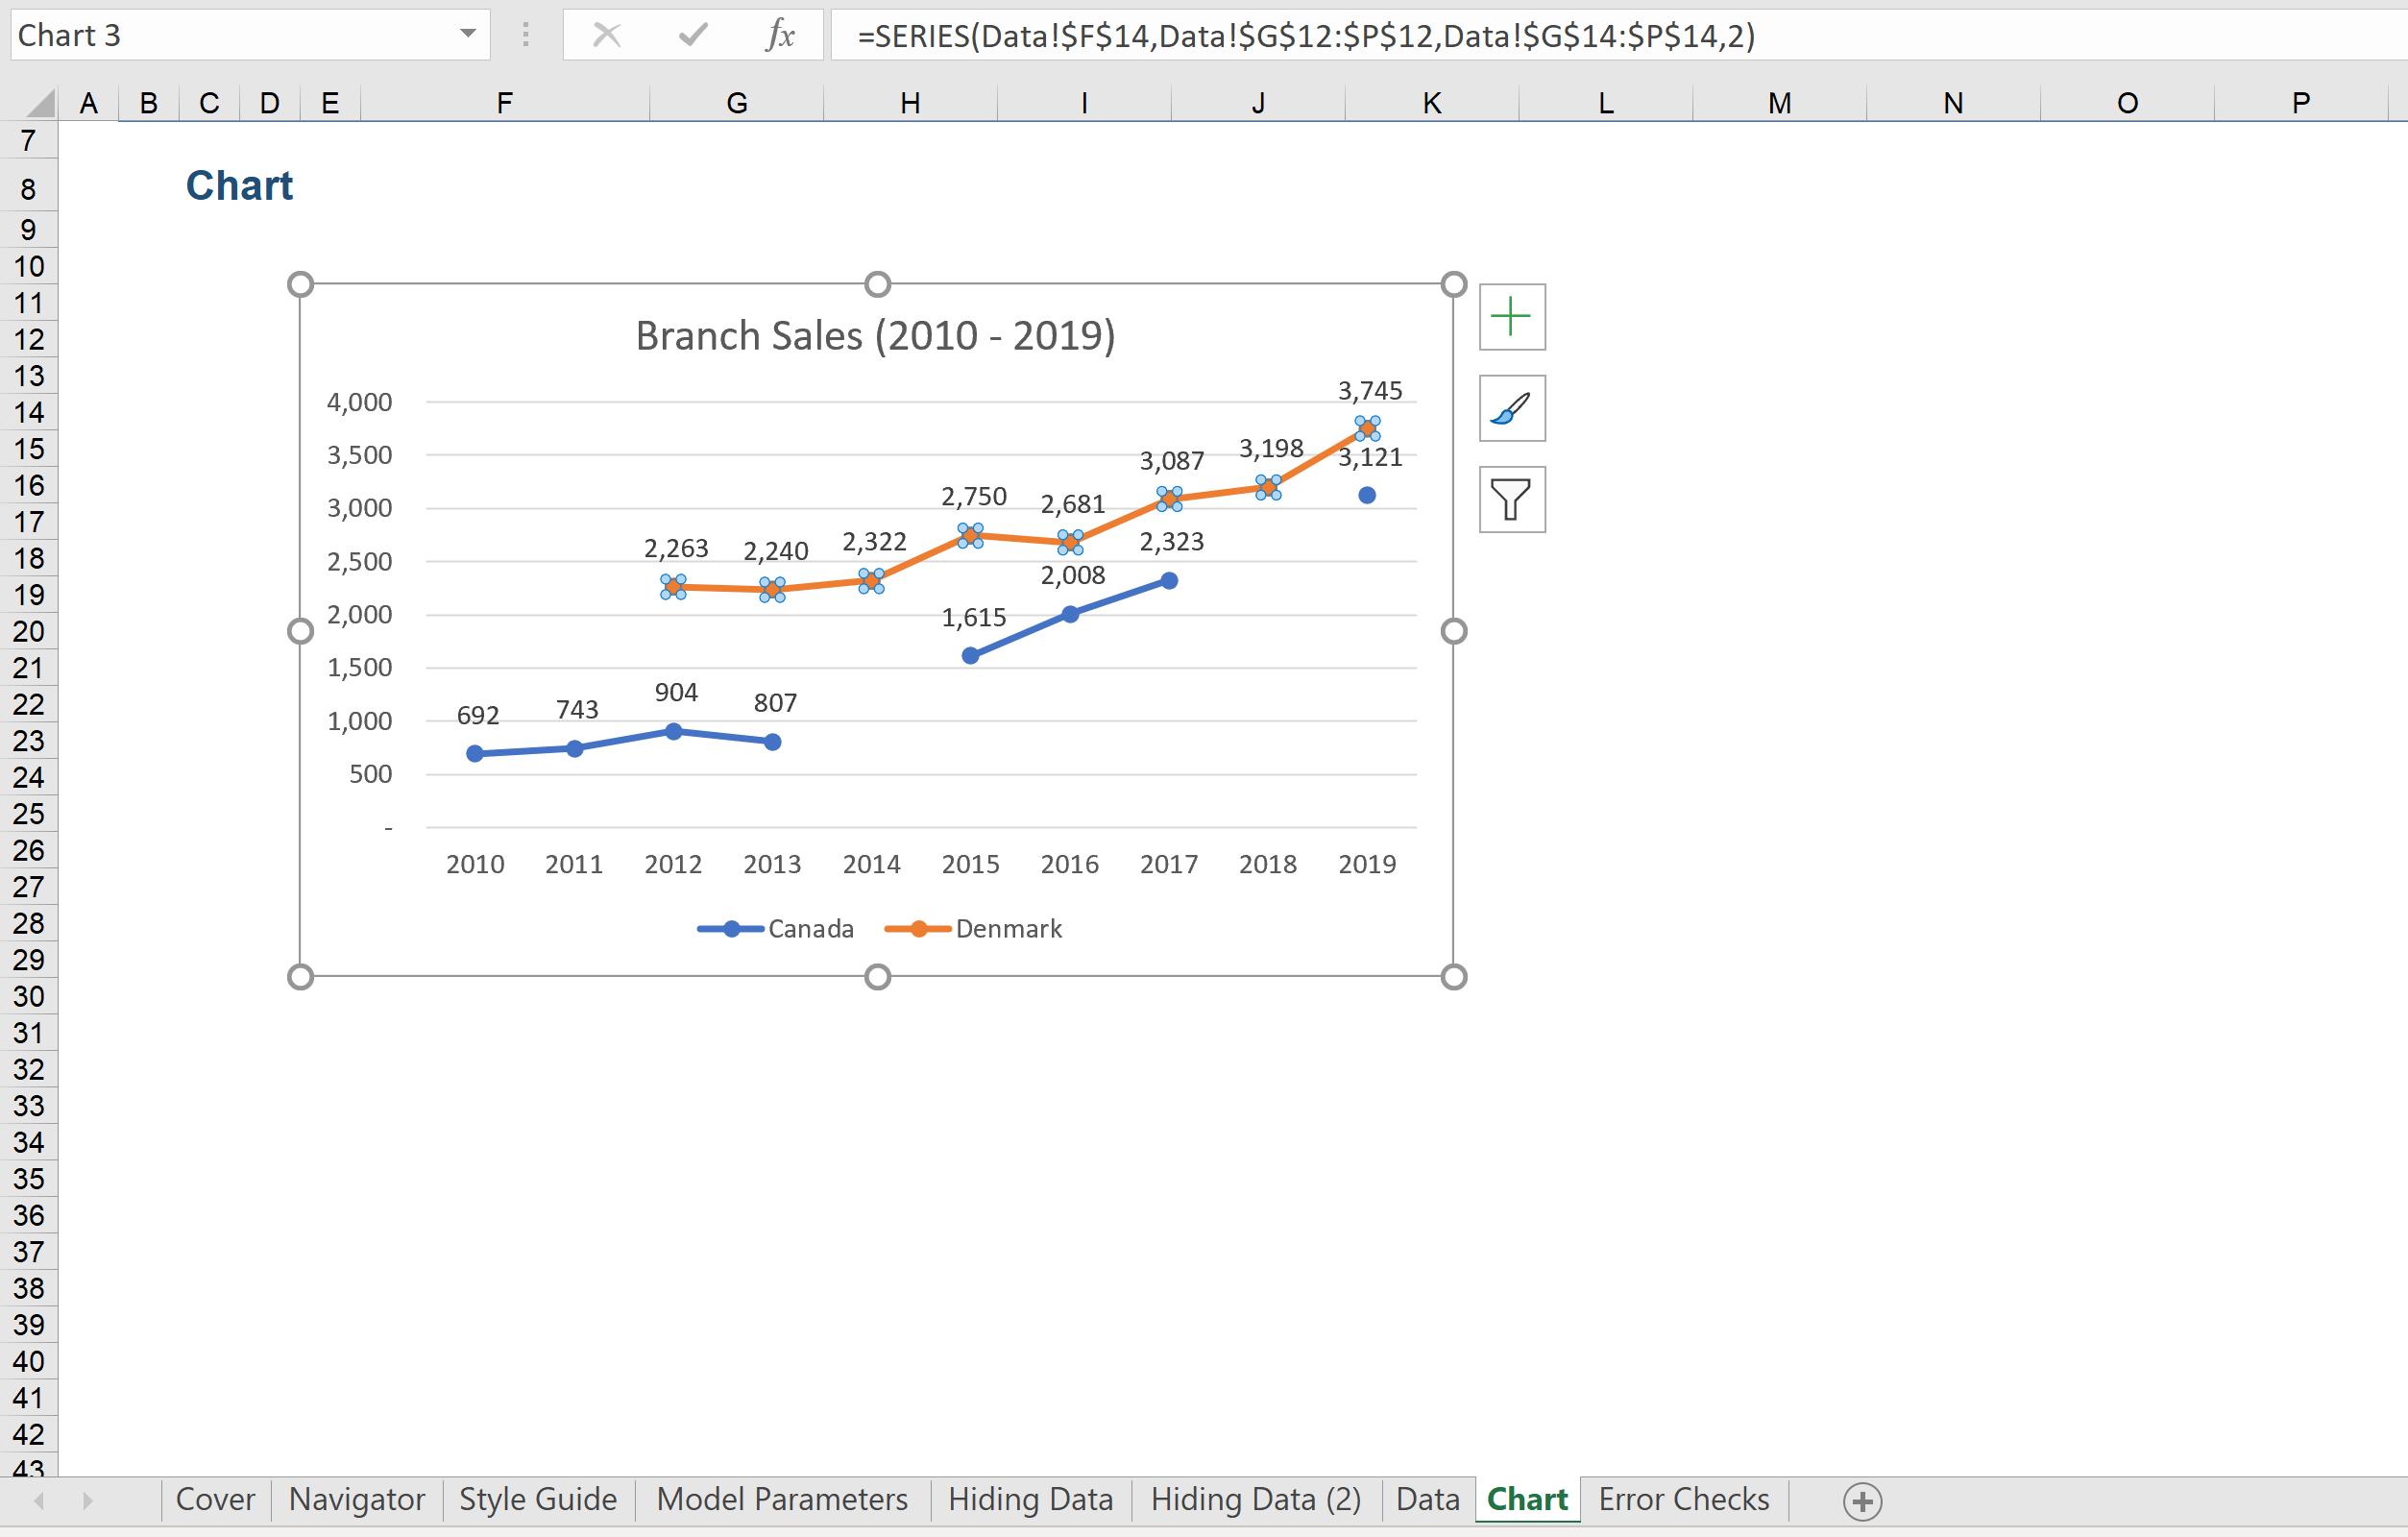
Now, we create a Data sheet with only the sales data, and create a chart if I create a Data sheet separate from the Chart sheet, the series will definitely point to the data on the Data sheet:
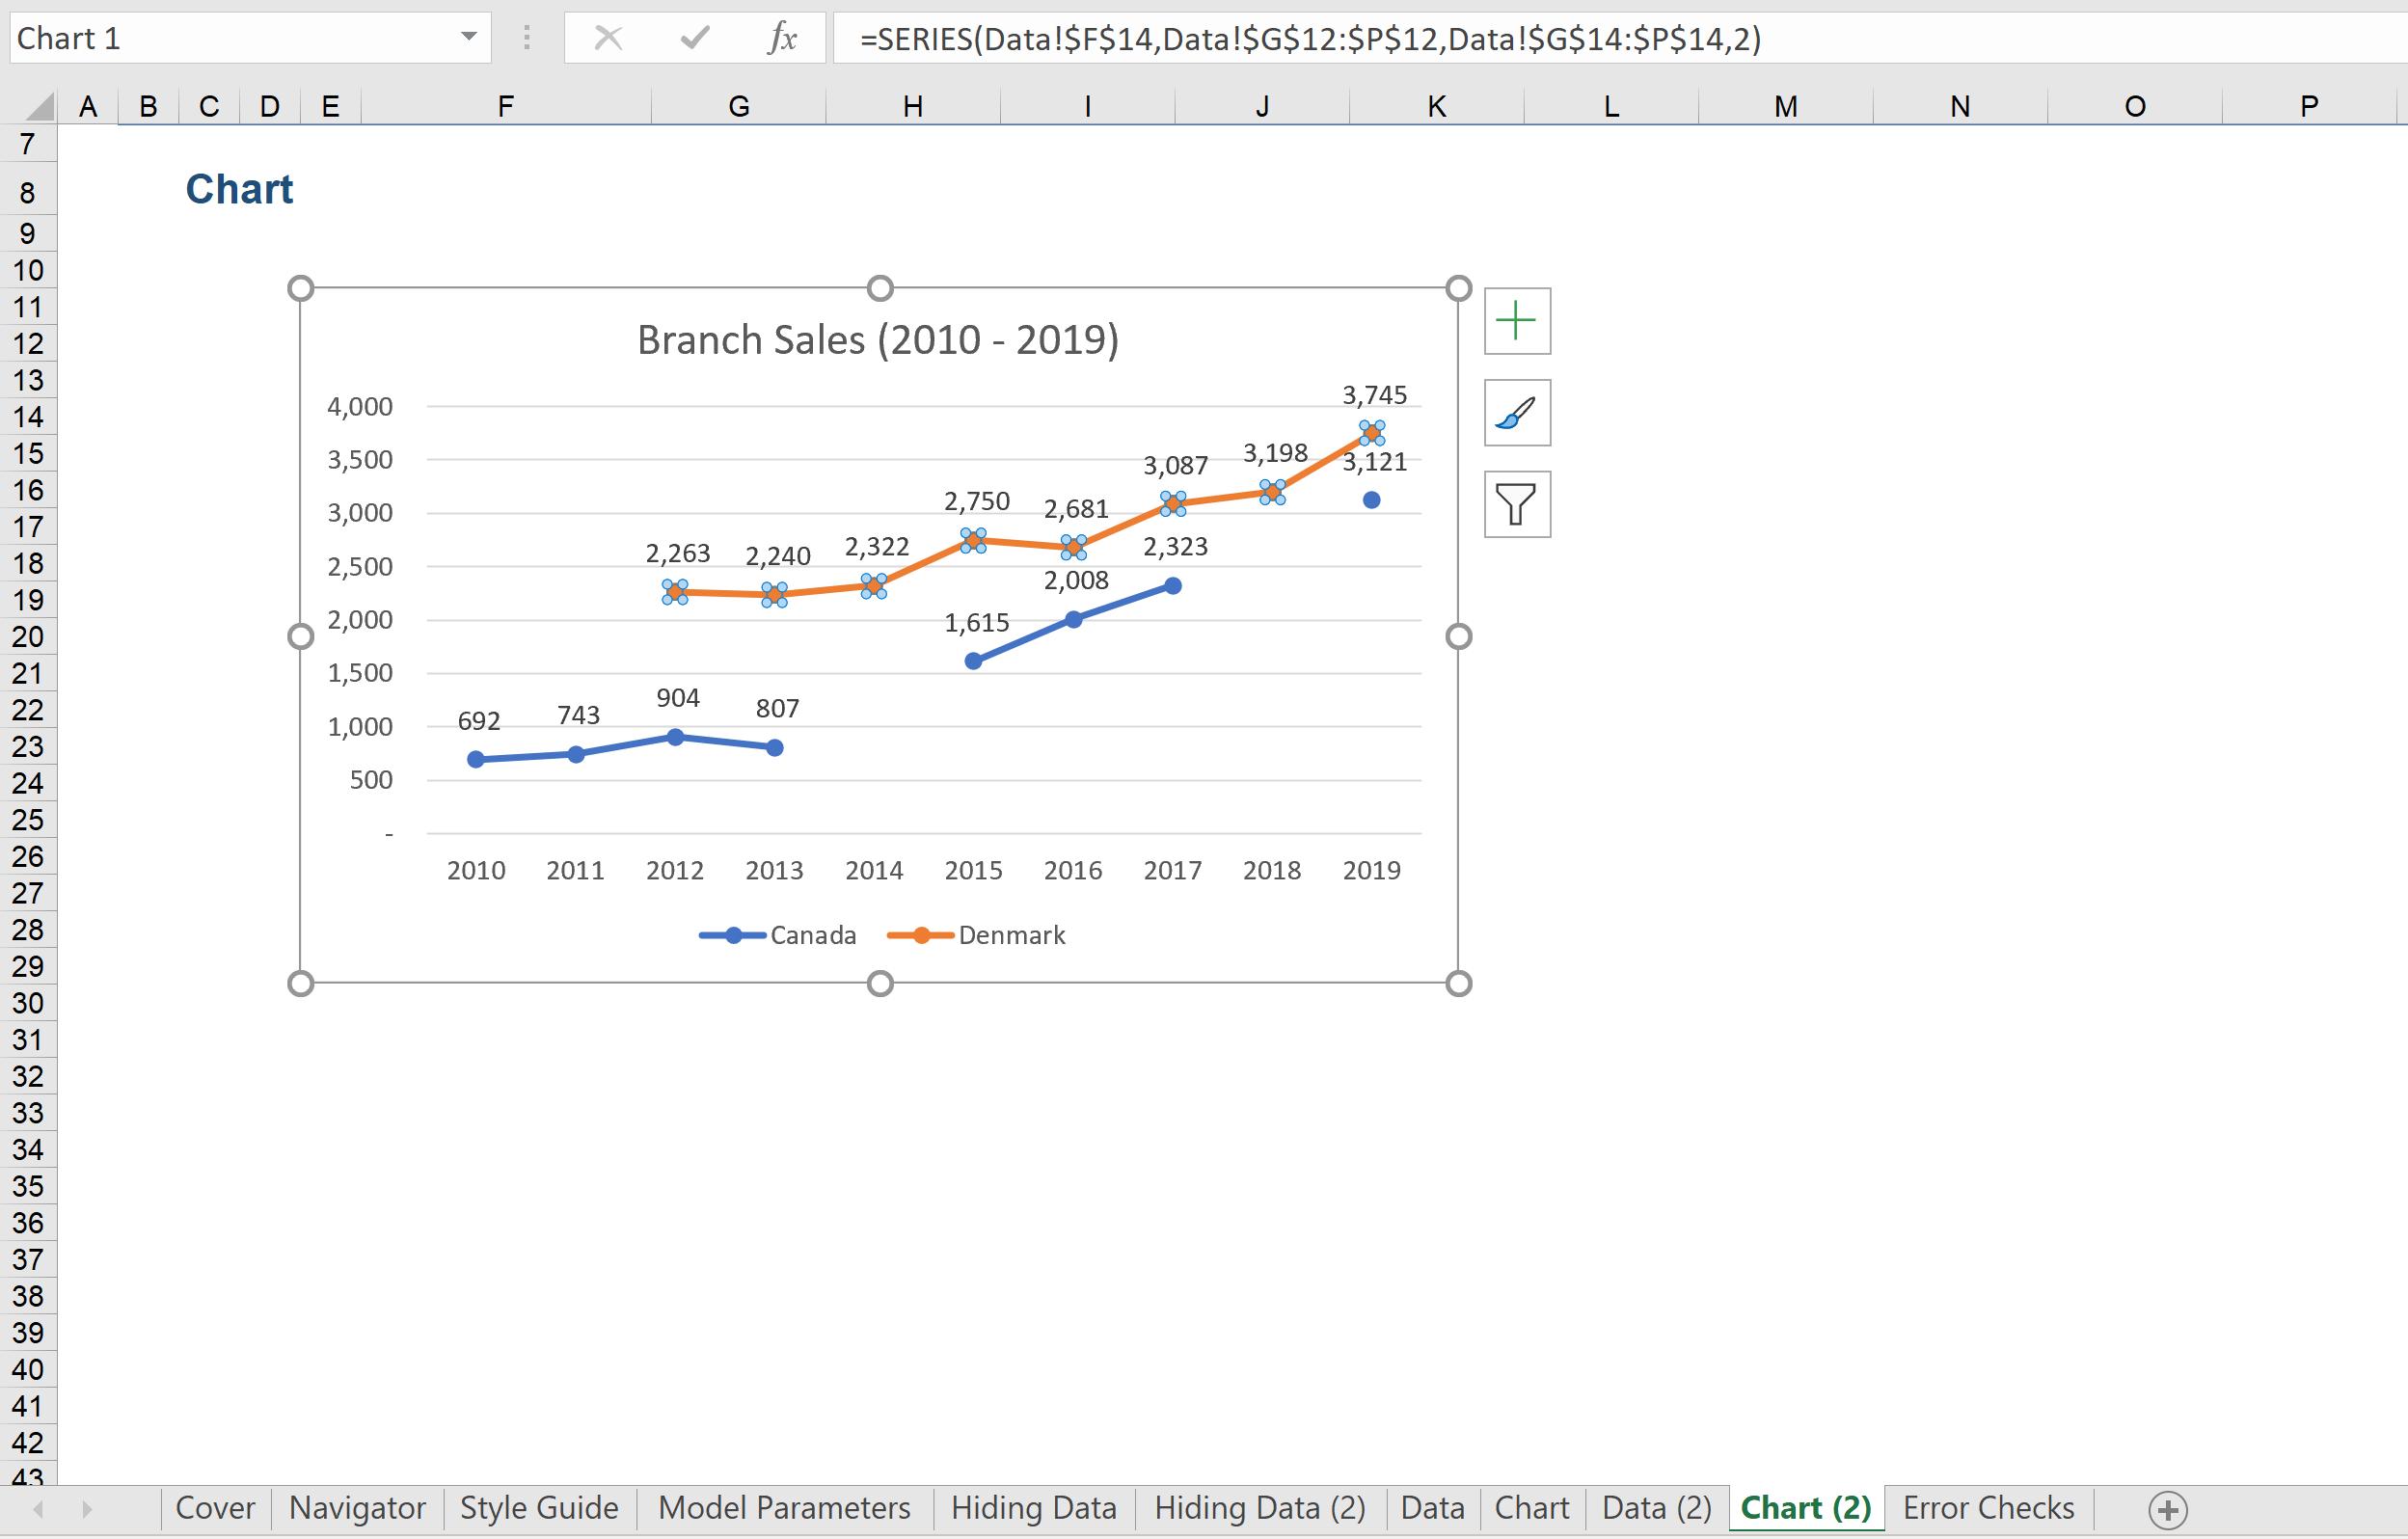
However, if we copy the Data sheet to Data (2) sheet, and Chart sheet to Chart (2) sheet, let’s see what happens. The chart series in the copied Chart (2) sheet still links to the data in the original Data sheet (it should have linked to the copied Data (2) sheet instead):
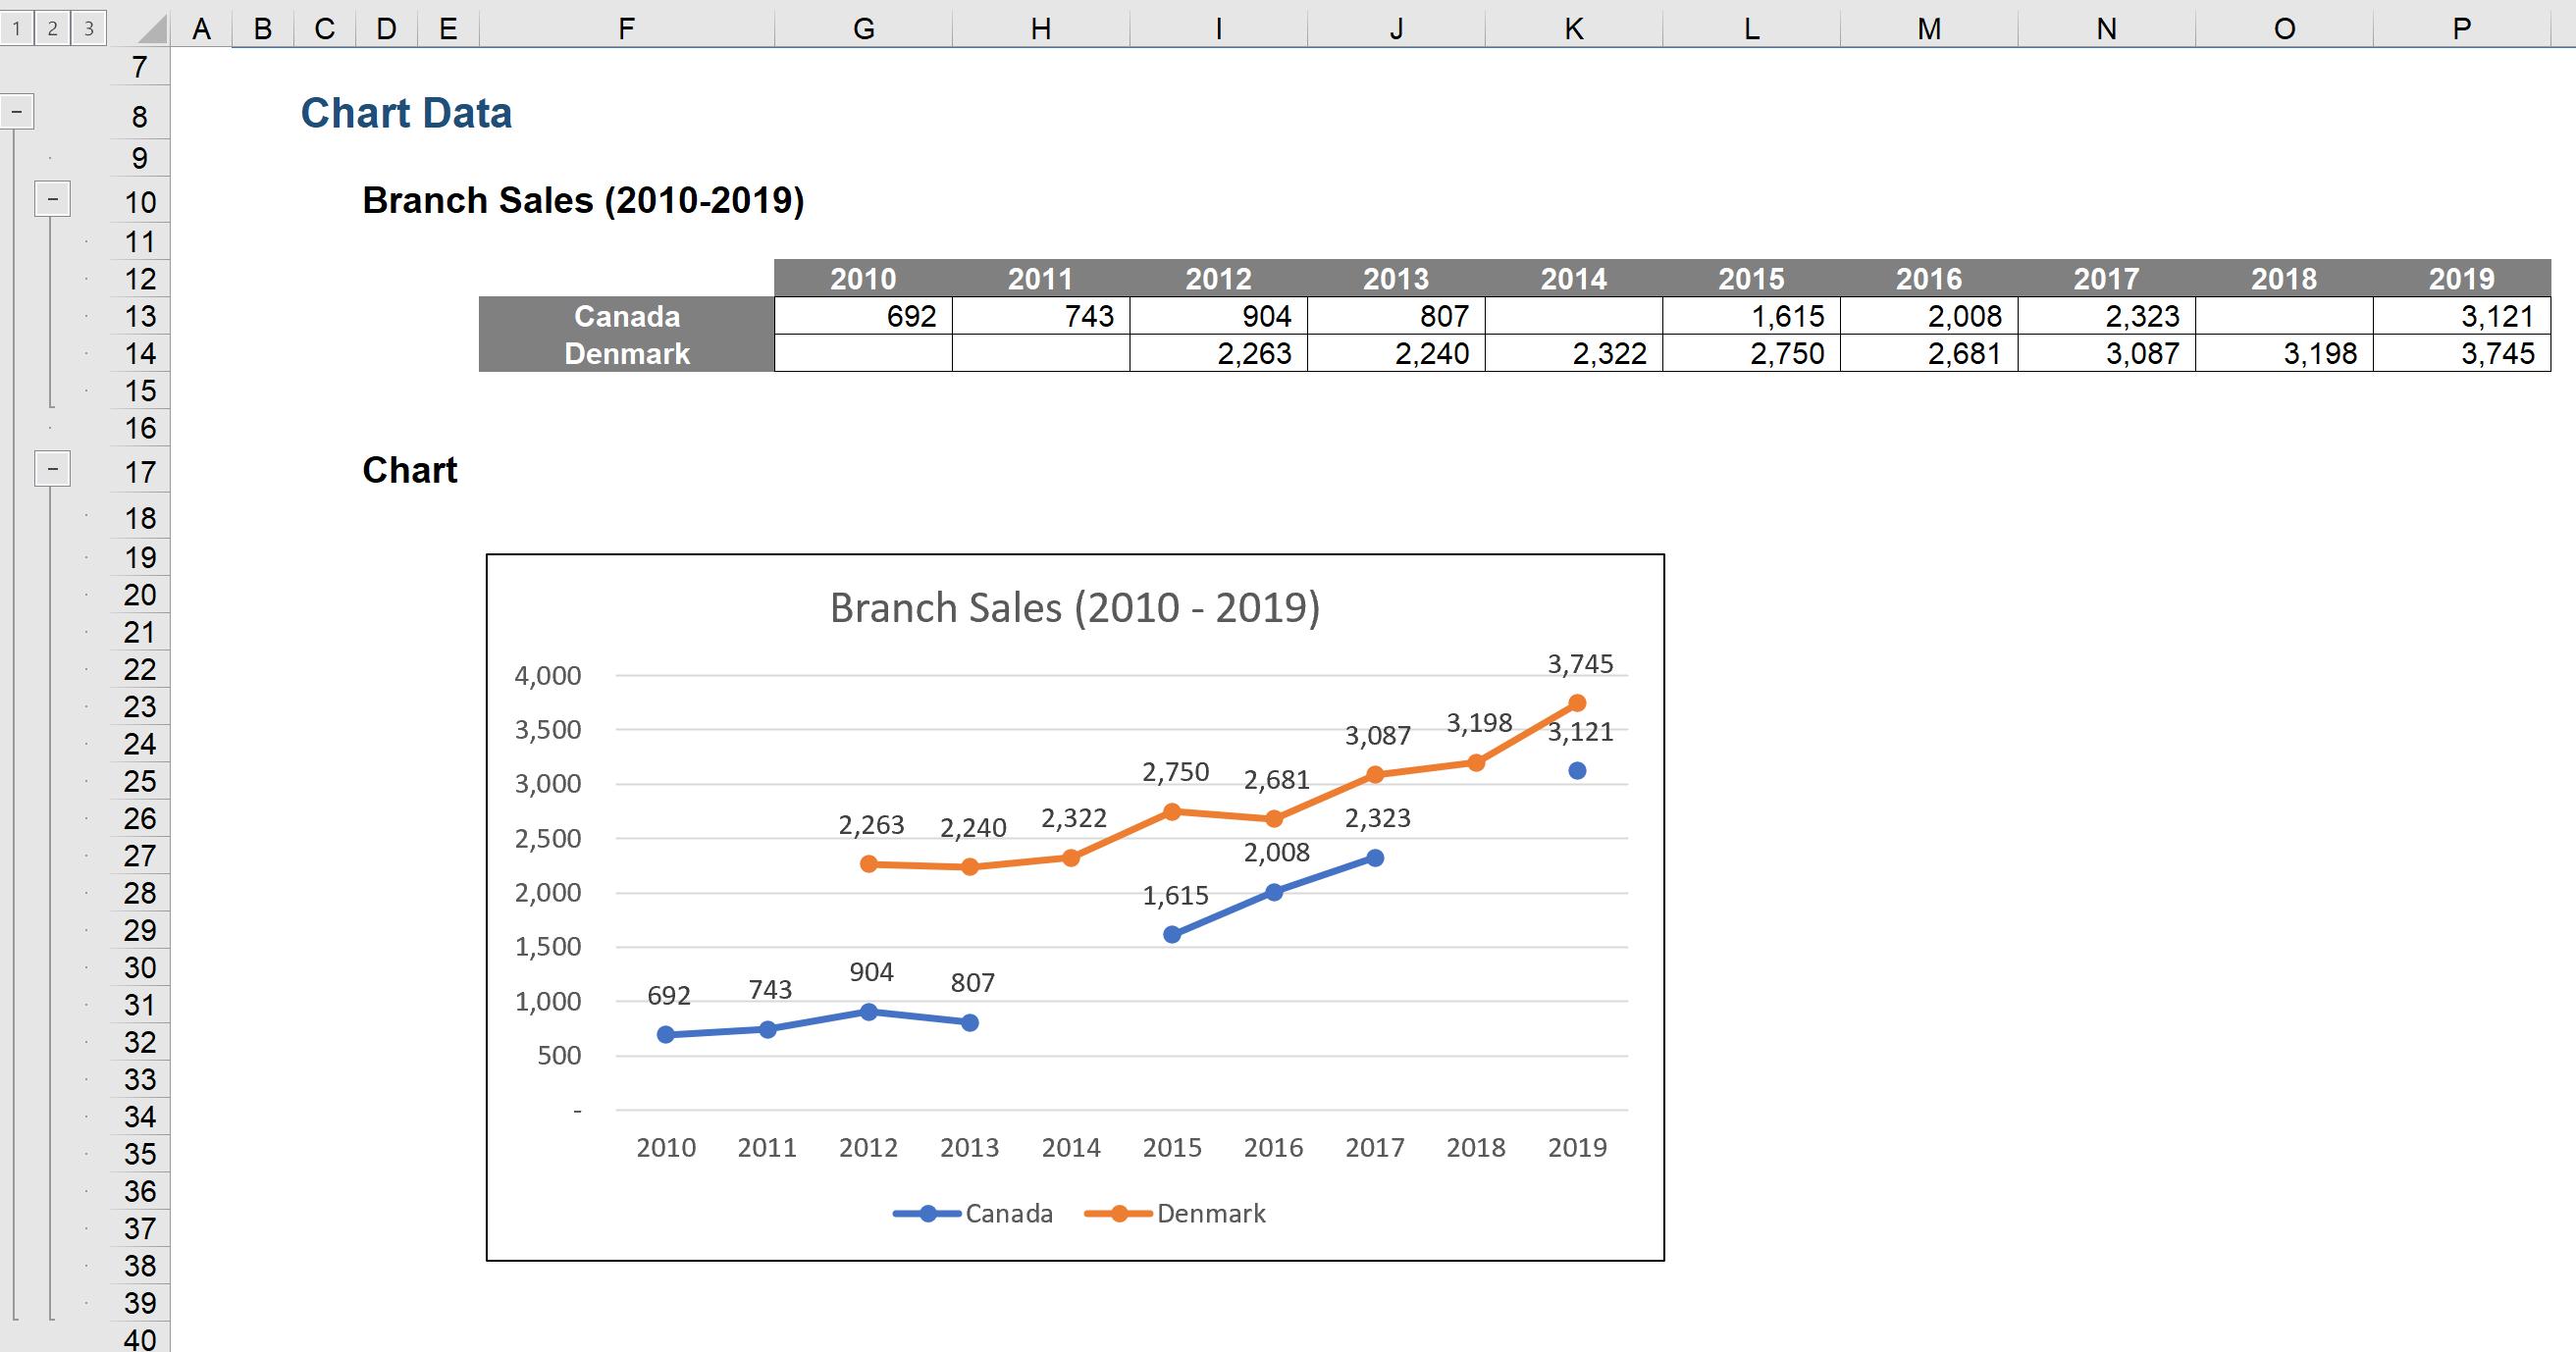
That is the reason why it is a better idea for the chart to be placed in the same sheet as its linked data set, plus it may then be formatted to optimise the layout of the whole worksheet:
That’s it for this week, check back next week for more Charts and Dashboards tips.