
Charts and Dashboards: Dynamic Charts – Part 1
3 July 2020
Welcome back to this week’s Charts and Dashboards blog series. Over the next few weeks, we’re going to talk about Dynamic Charts. This week, in particular, we will talk about creating Dynamic Tables.
“Dynamic” itself means a processor system characterised by a constant change or a change in activity (sorry, I swallowed a dictionary this morning). Similarly, in Excel, when we create lists or data in a workbook and make a report out of it, if we add or remove any data, then the whole report may become inaccurate. Excel has a solution for it, which is known as Dynamic Tables.
Why do we need Dynamic Tables or a Dynamic Range? The answer is because whenever a list or data range is updated or modified, it is not certain that the report will be changed as per the data change.
Basically, there are two main advantages of Dynamic Tables:
- a dynamic range will update automatically, as per the data change(s)
- PivotTables based on the dynamic table in Excel may be automatically updated when the pivot is refreshed.
So how do we create a Dynamic Tables in Excel? We may use either Tables or the OFFSET function.
Using Tables to Create Dynamic Tables
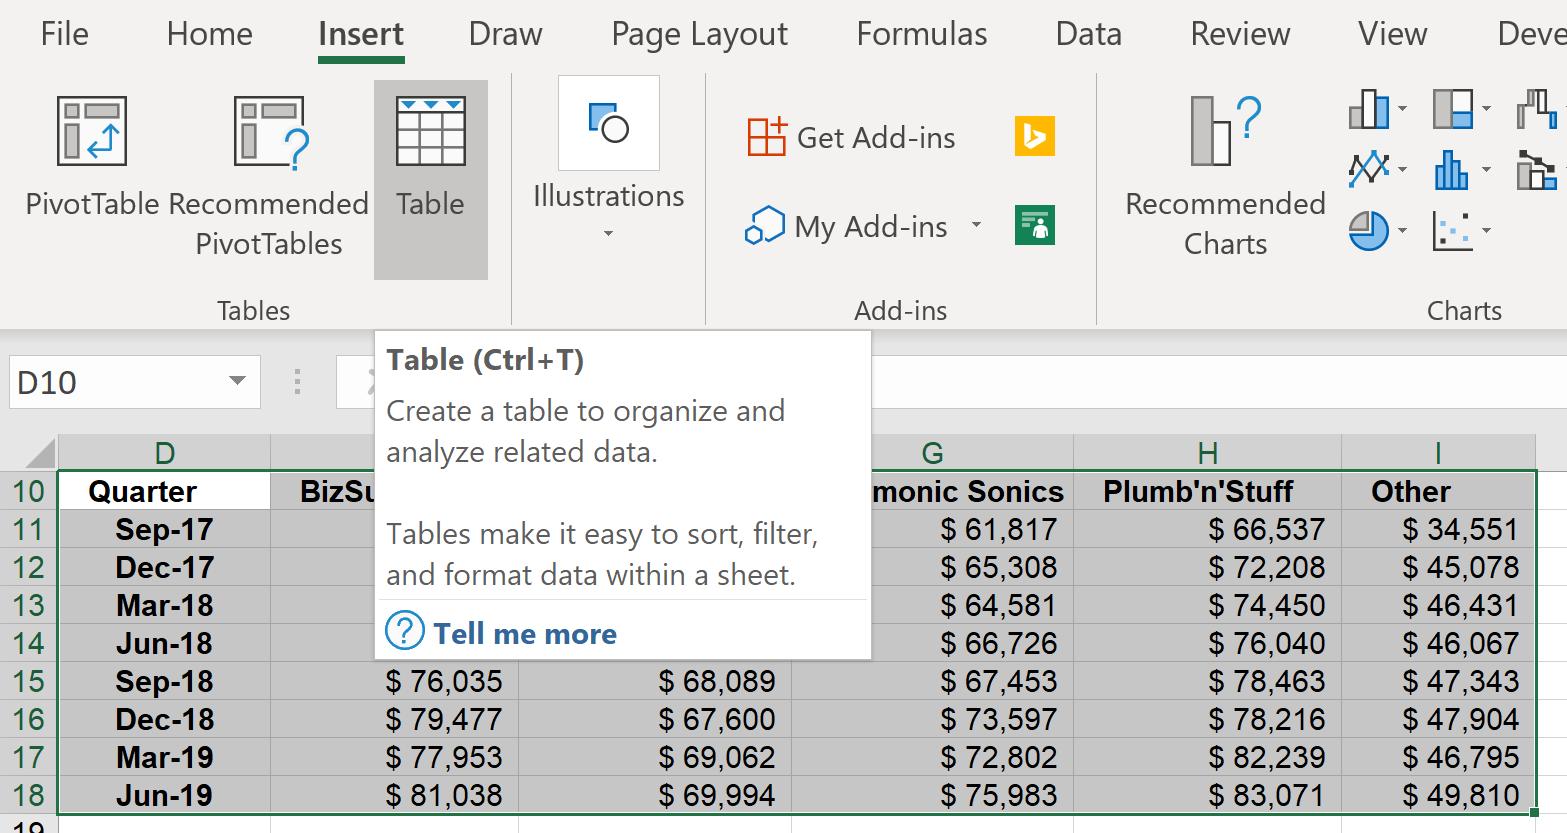
Here, I choose the Table range, then go to the Insert tab and choose Table, or CTRL + T:
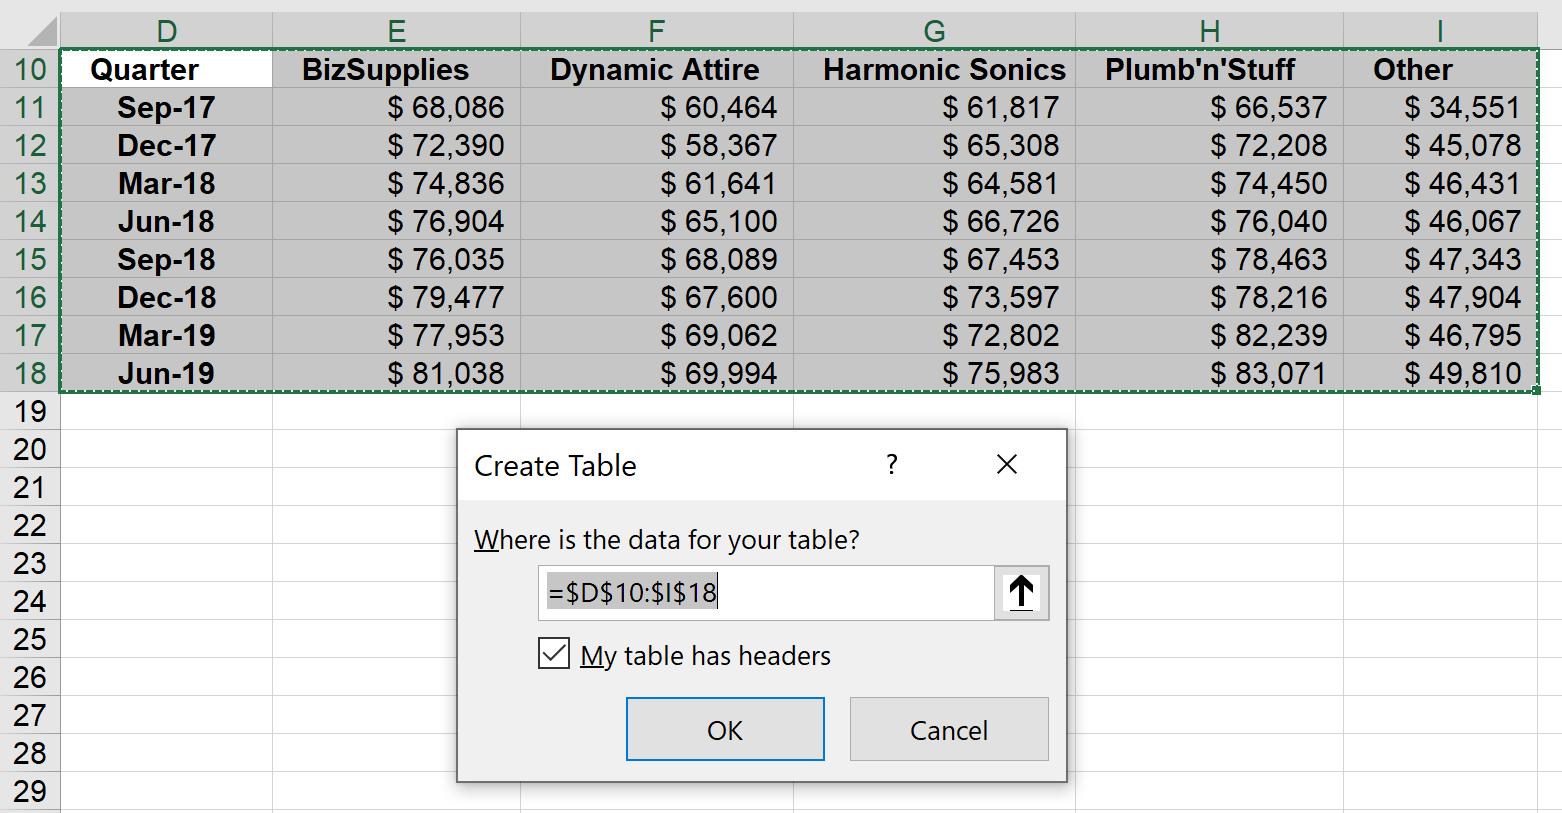
A ‘Create Table’ dialog will pop up. Since this data table has headers in the top row, you should check the box ‘My table has headers’.
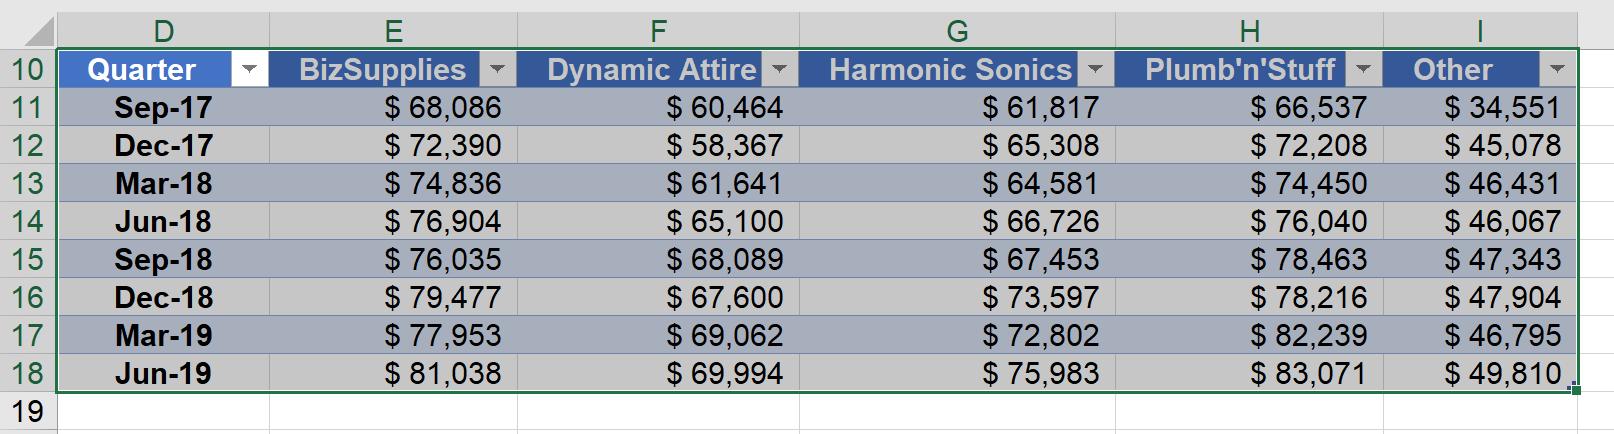
The Table will now look like this:
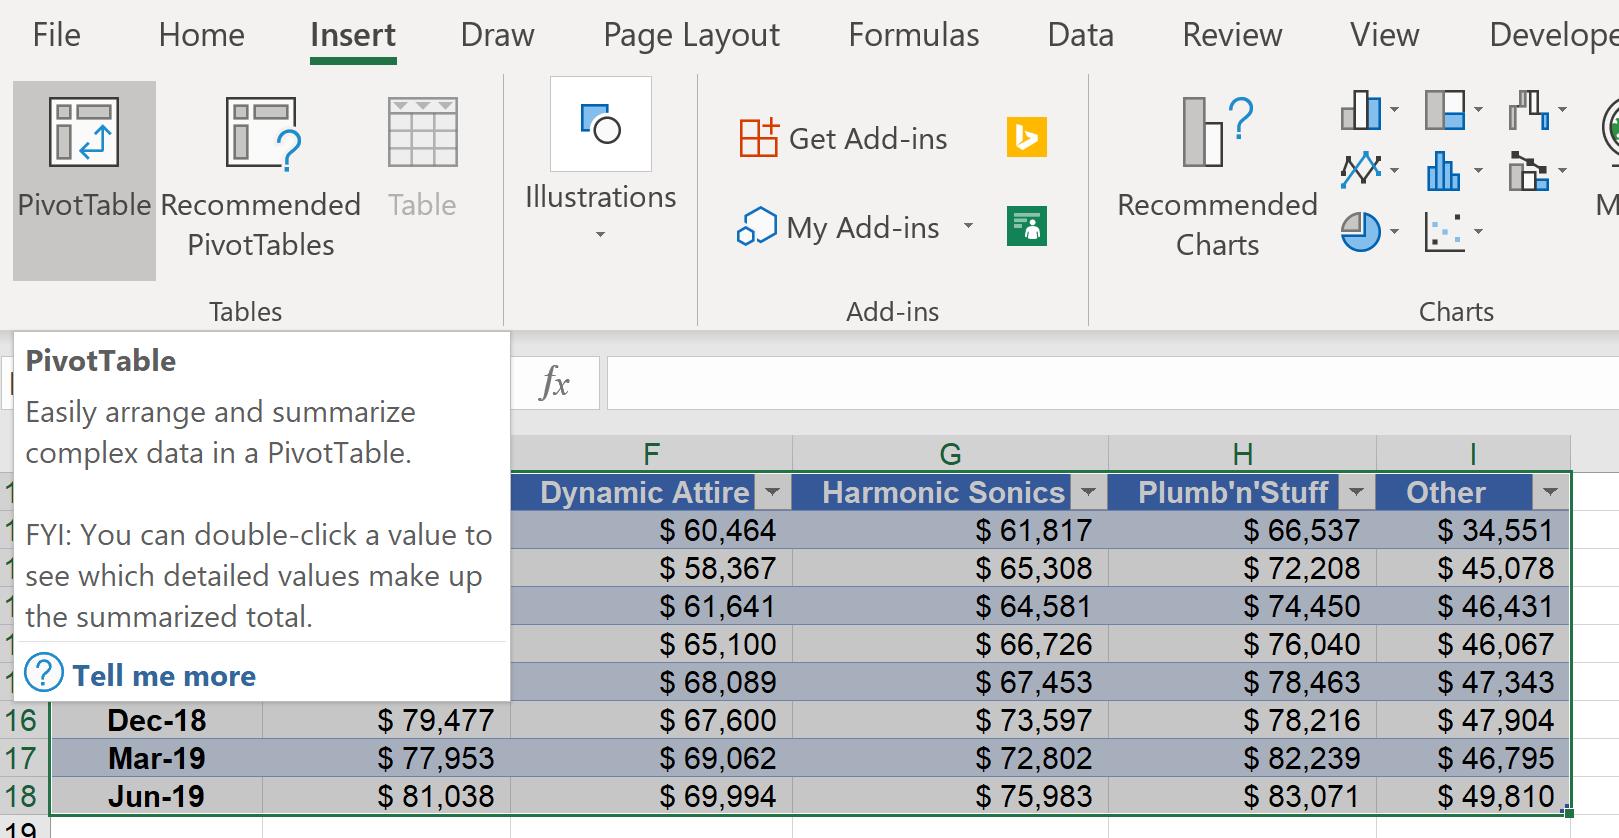
Choose the entire Table, then go to Insert tab and choose PivotTable.
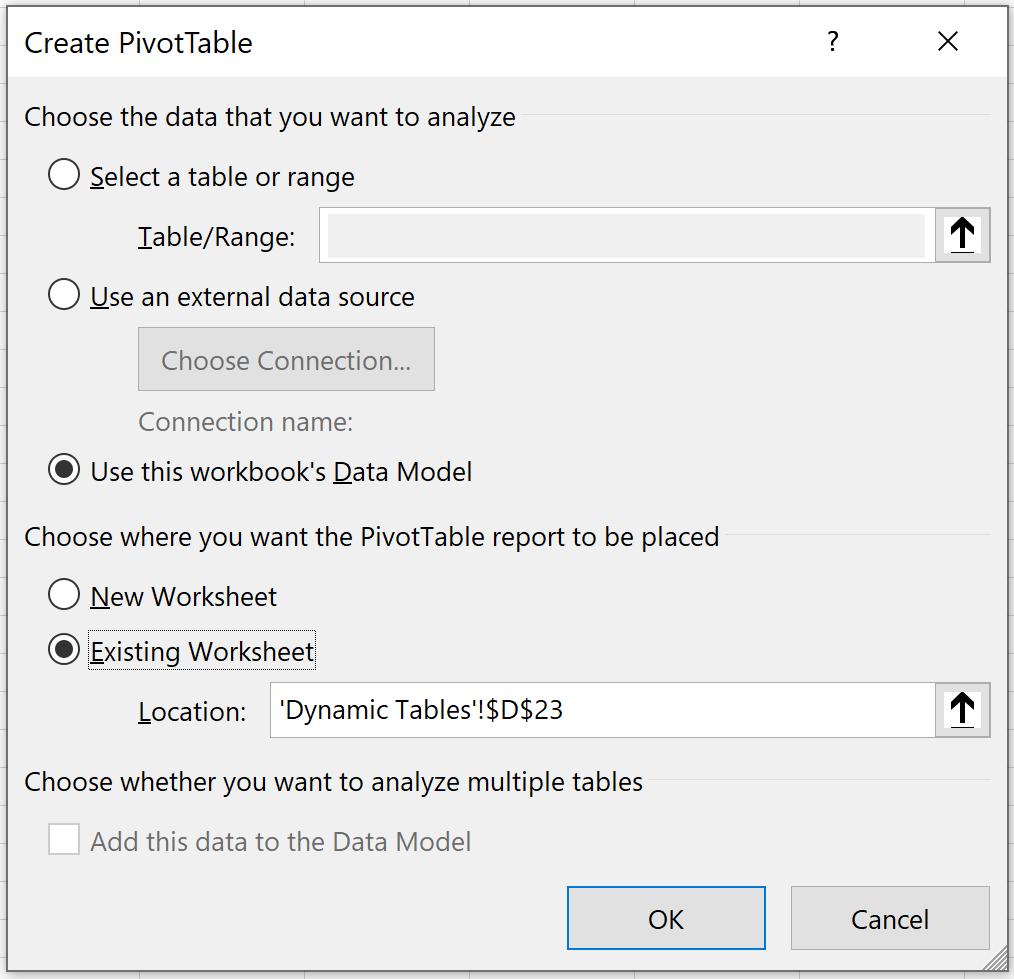
The ‘Create PivotTable’ dialog will then appear. I will then load the PivotTable into the same worksheet, choose ‘Existing Worksheet’ and click on a cell location, here, I will use cell D23.
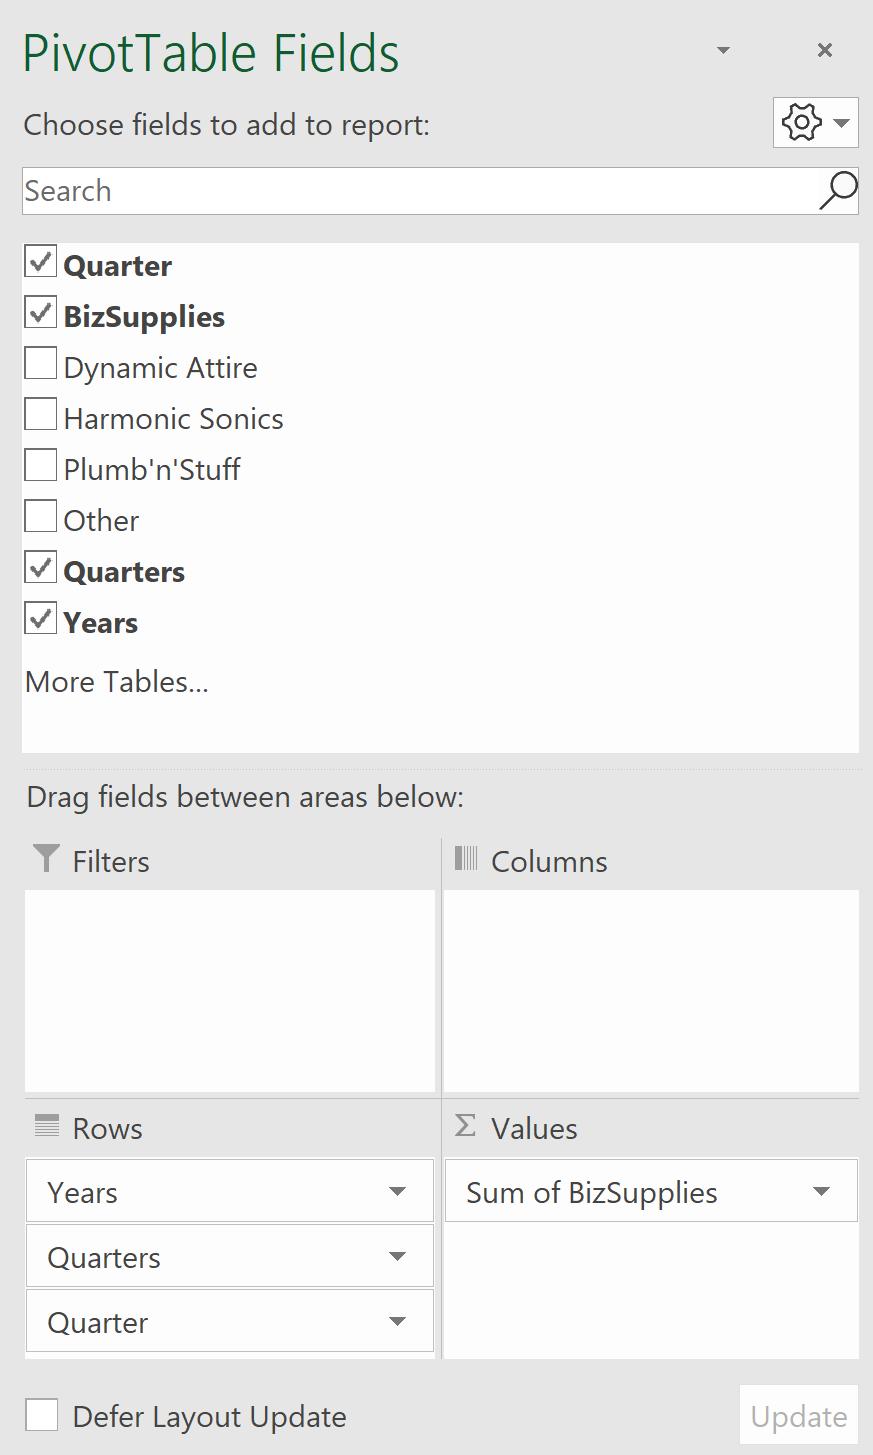
Choose Quarter as Rows and BizSupplies as Values:
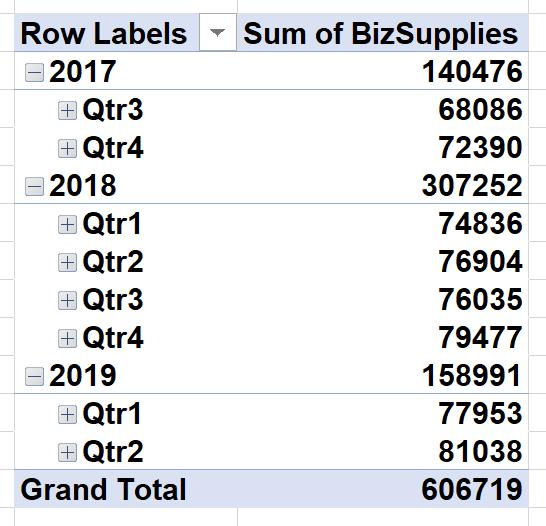
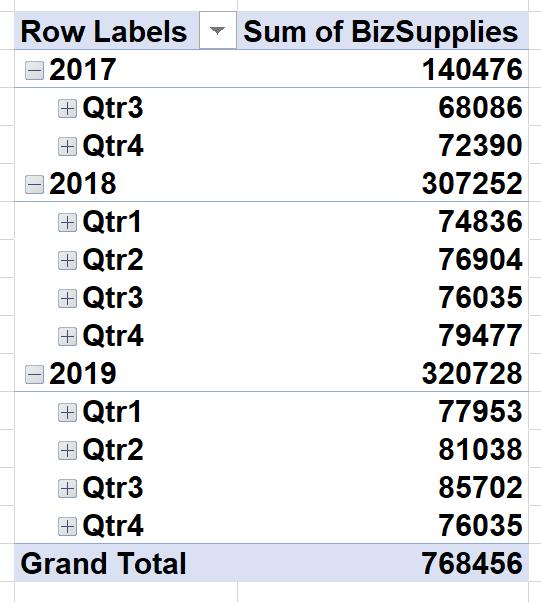
This will produce the following PivotTable:
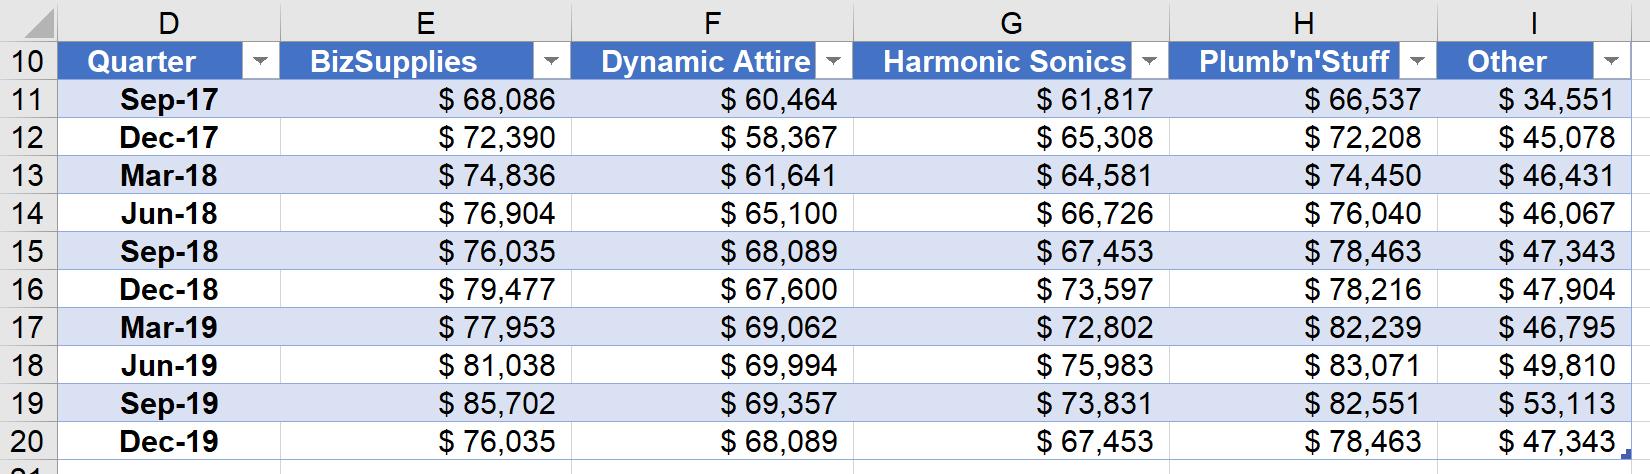
Then in the existing Table, if I add new sales data (as seen, Sep-19 and Dec-19):
The PivotTable will reflect newly added data, as seen under 2019: Qtr3 and Qtr4.
That’s it for this week, check back next week for more Charts and Dashboards tips.