
Charts and Dashboards: Chart Tools – Contextual Tabs (Part 2)
20 December 2019
Welcome back to Charts and Dashboards blog series. This week, we’ll continue to look at the Format sub-tab from the contextual Chart Tools tabs.
Last week, I wrote about the Design sub-tab in the contextual tabs which appear on the Ribbon when I click on a chart. Now, let’s move to the next sub-tab: Format, which helps me manually design charts to my liking.
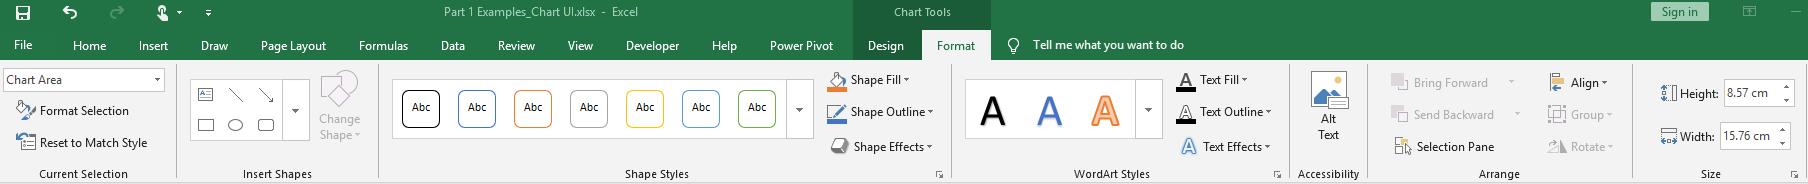
Let’s break it down into smaller categories.
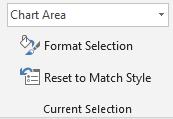
‘Current Selection’ says which part I am currently choosing to format. I can ‘Reset to Match Style’ which brings me back to the original one:
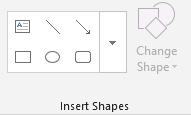
Next to it is the ‘Insert Shapes’, from which I can insert multiple shapes to my chart:
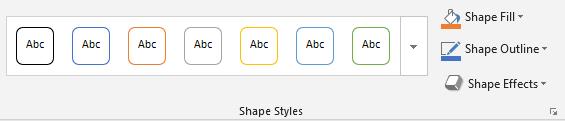
From the ‘Shape Style’ category, shape outlines, fills and other effect may be formatted:
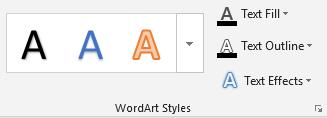
I can even add ‘WordArt’:
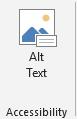
In the ‘Accessibility’ category, if I click ‘Alt Text’:
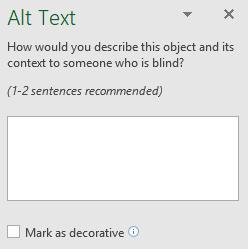
a dialog will pop out like this:
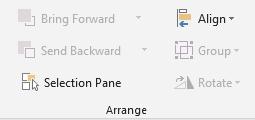
In the ‘Arrange’ category, the position of the chart may be adjusted:
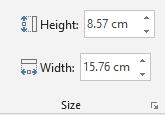
Last but not least is the ‘Size’ category. This is very helpful when I am designing a dashboard, where I need to make charts identical in some size dimensions, by just setting the height and width to the same numbers:
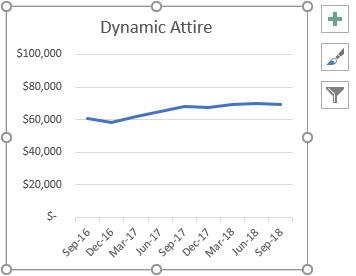
In addition to the contextual ‘Chart Tools’ on the Ribbon, charts may also be quickly formatted using their side-menus. If I click on a chart, I will see on my right there three option boxes:
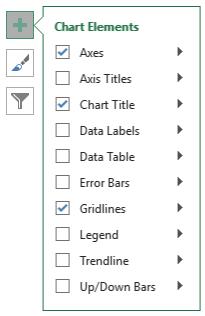
If I click the plus shaped button, there is a list of tick boxes where I can choose which to be added to my chart. I can also click on the arrows for more detailed options:
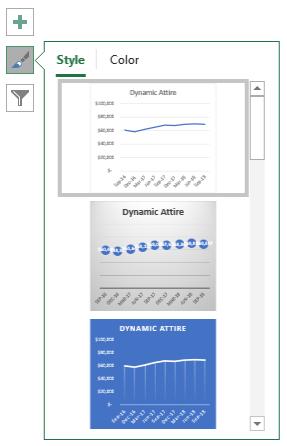
The second icon is the brush pen box, which is similar to the Design tab, where I may quickly choose my chart styles and colours:
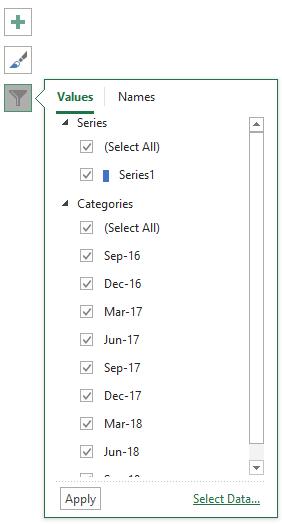
Finally, the filter panel may be used to sort out which data I want to display on the chart:
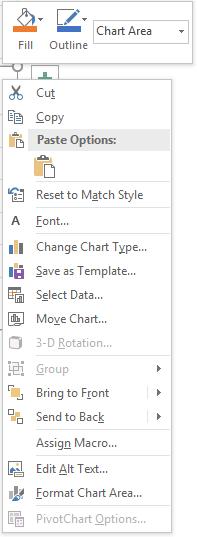
A right click on the chart will trigger a menu list, which offers me most of the options from the contextual ‘Chart Tools’ tabs:
That’s it for this week; check back next week for more Charts and Dashboards tips.