Power Bi Blog
Power BI Blog: Revisiting Built-In Gauge Charts
29 April 2021

Power BI Blog: Ordered Legends
18 March 2021
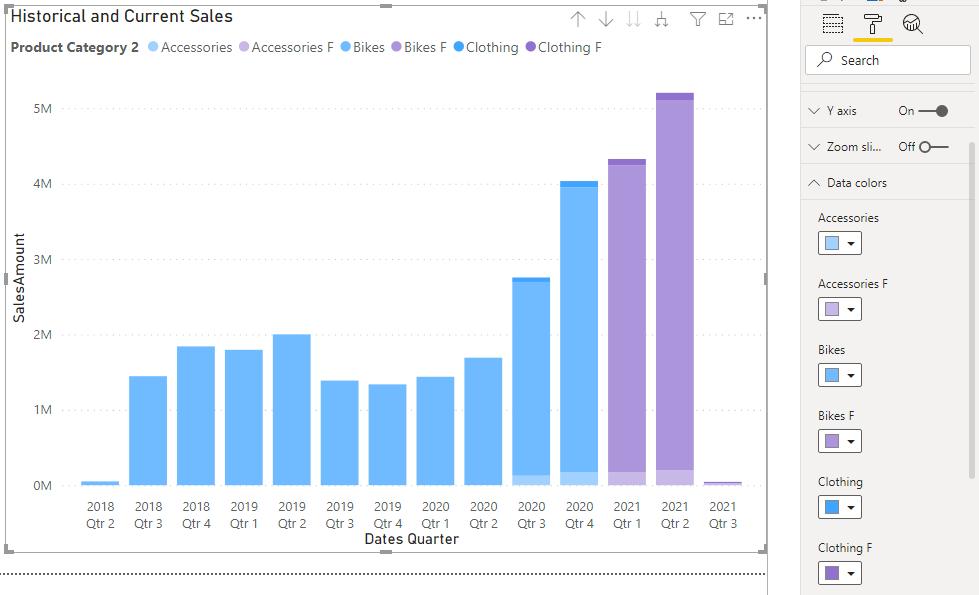

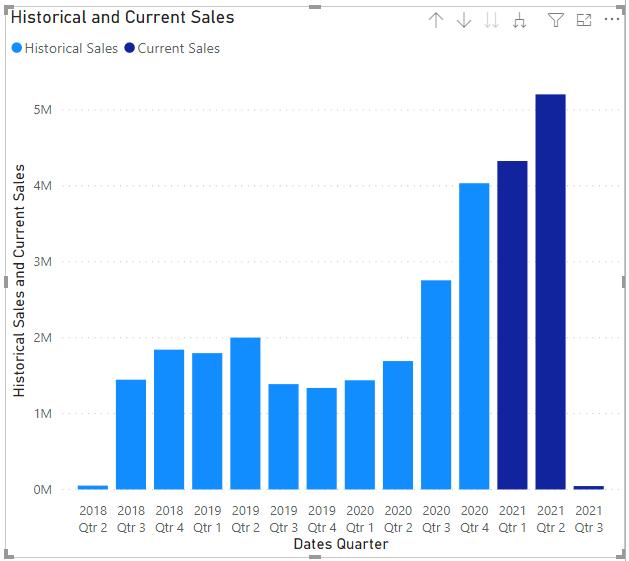
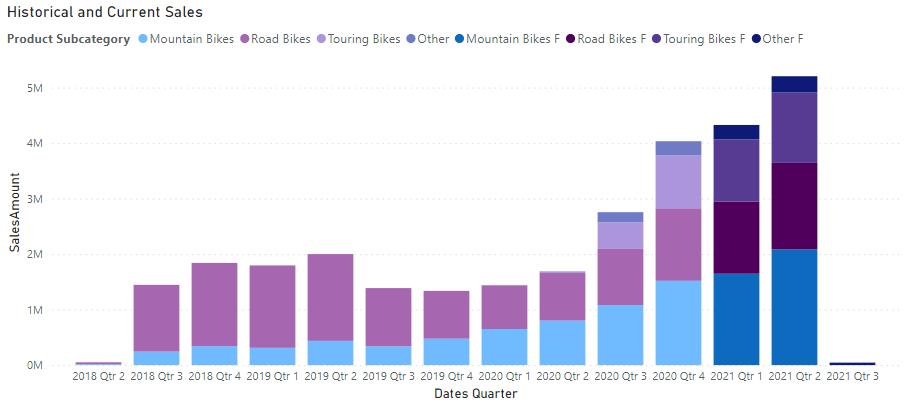
Power BI Blog: Different Coloured Columns in a Chart
25 February 2021

29 April 2021
18 March 2021
25 February 2021
SumProduct are experts in Excel Training. Providing Financial Modelling, Strategic Data Modelling, Model Auditing, Planning & Strategy and Training Courses.