
Power BI Blog: Maximum and Minimum Levels on a Line Chart
15 April 2021
Welcome back to this week’s edition of the Power BI blog series. This week, we will look at how to create maximum and minimum lines on a line chart.
Let’s take a look at an example of a line chart:
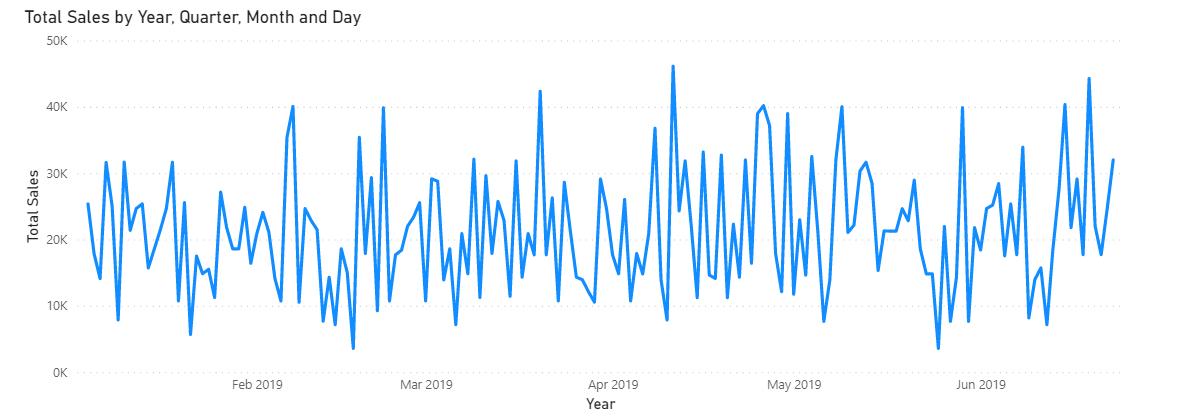
This line chart displays the Sales over the first half of 2019 (say). If we want to highlight the maximum and minimum points in this chart, we can use a built-in function contained within the Analytics tab. It works like this. With the visualisation selected, navigate to the Analytics tab:
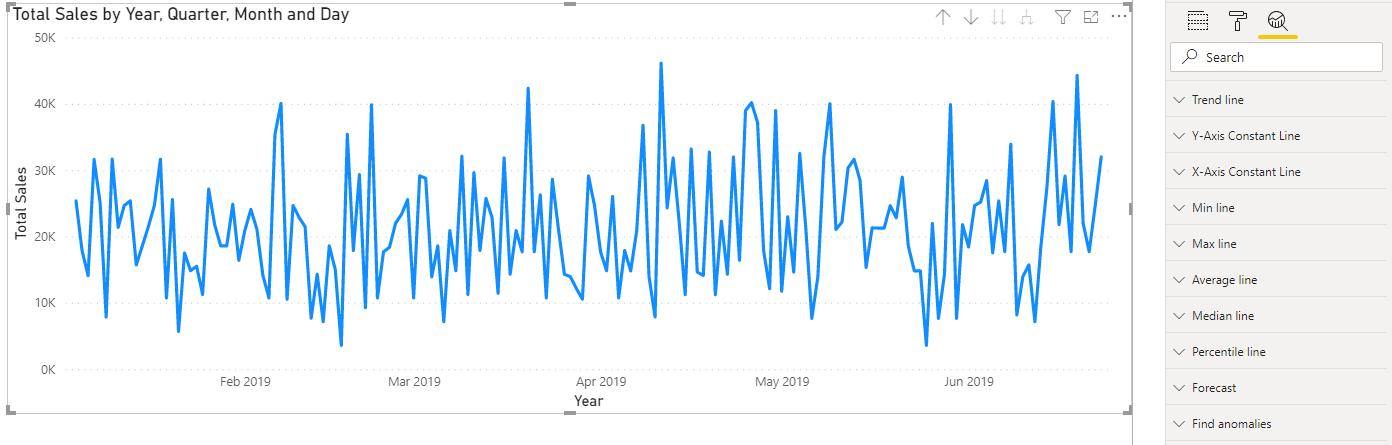
We can expand the ‘Min line’ option to add a minimum line on the line chart:
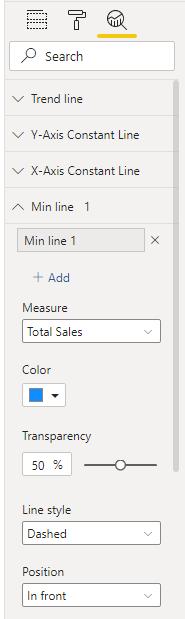
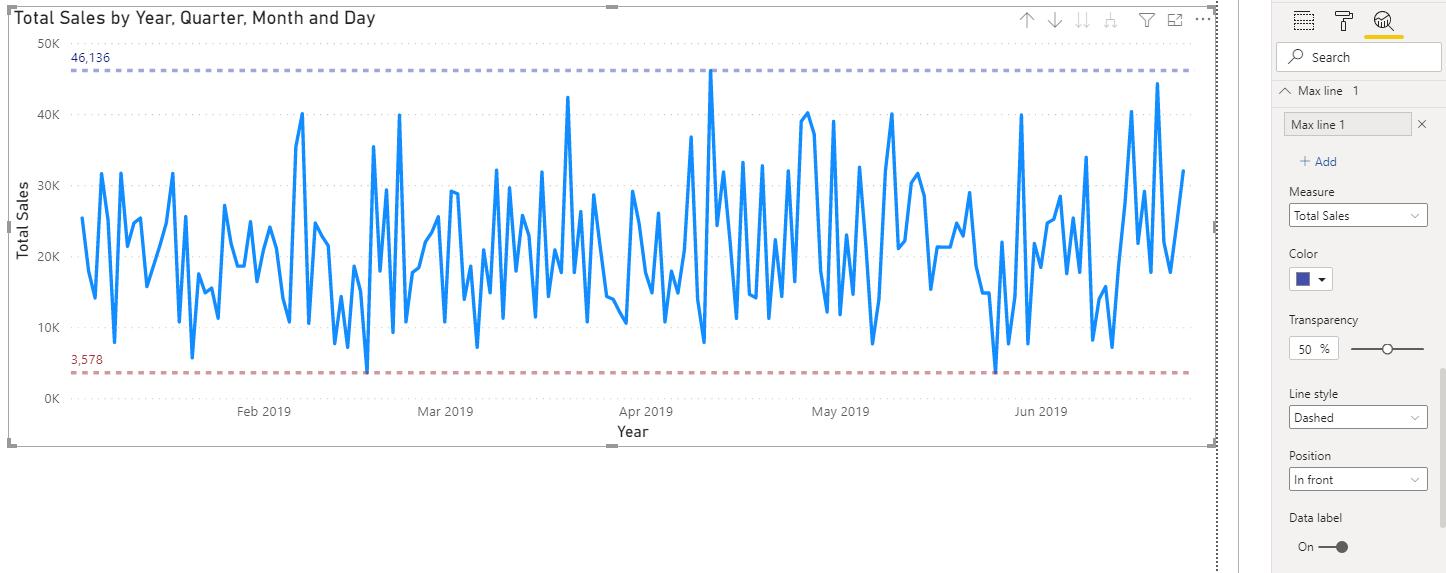
We can adjust the colour and style of the ‘Min line’. In this example we have chosen to give it a red colour, and matching data label:
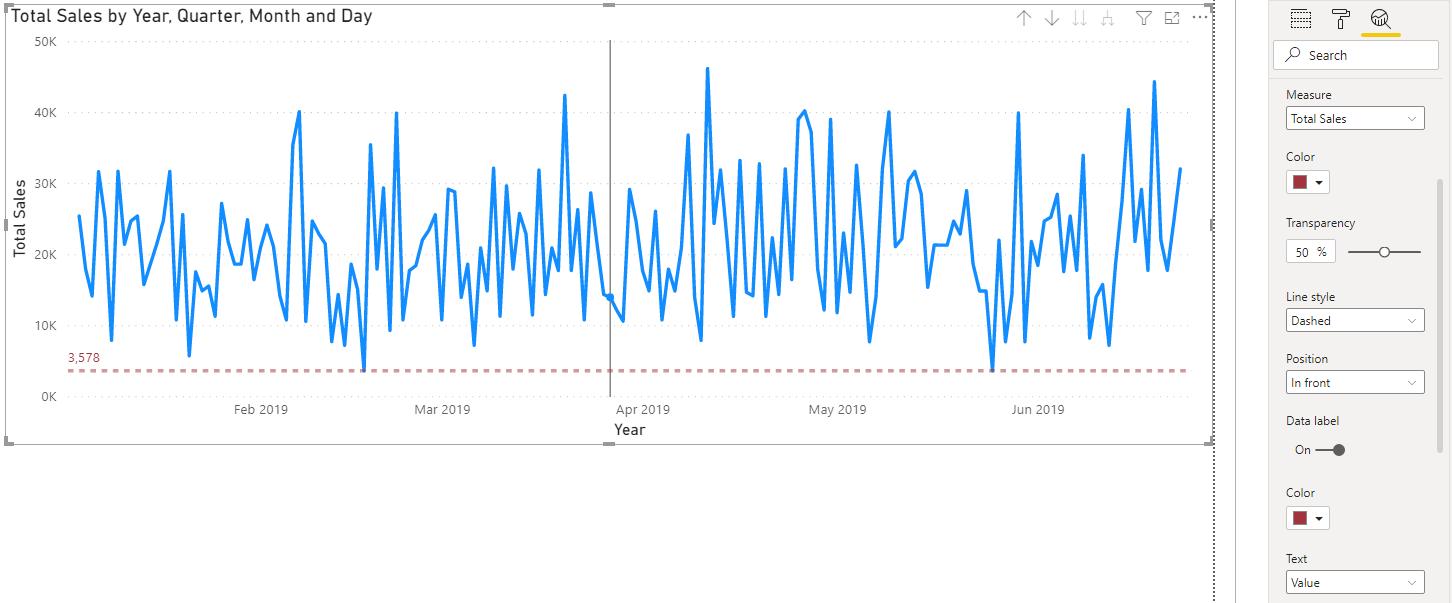
Next, we can add a ‘Max line’, giving it a dark blue shade:
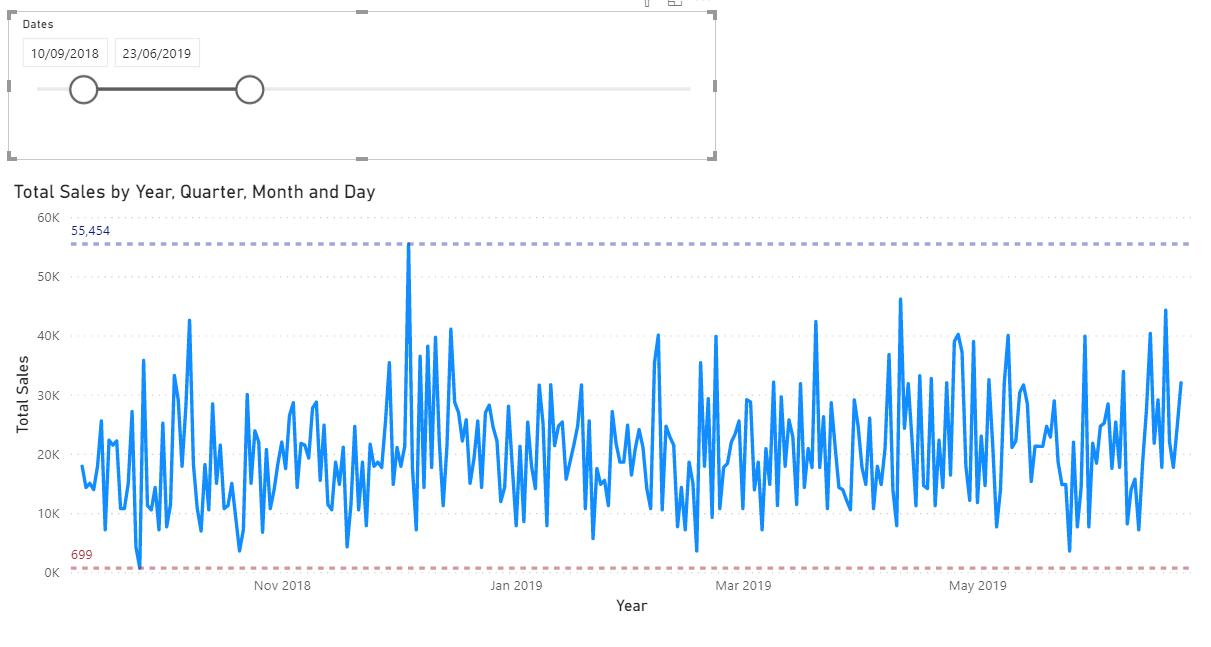
These lines will update dynamically based upon the x-axis filter selection (in this example the Date slicer). Compared to the previous screenshot, the maximum point has increased from 46,136 to 55,454, and the minimum point has decreased from 3,578 to 699.
But what if we want a single dot on the line chart to highlight the maximum and minimum points? Well, more on that in the future blog!
That’s it for this week! A quick and easy guide on how to add minimum and maximum lines to the Line Chart visualisation in Power BI. Join us next week for more on Power BI.
In the meantime, please remember we offer training in Power BI which you can find out more about here. If you wish to catch up on past articles, you can find all of our past Power BI blogs here.