
Power Bi Blog
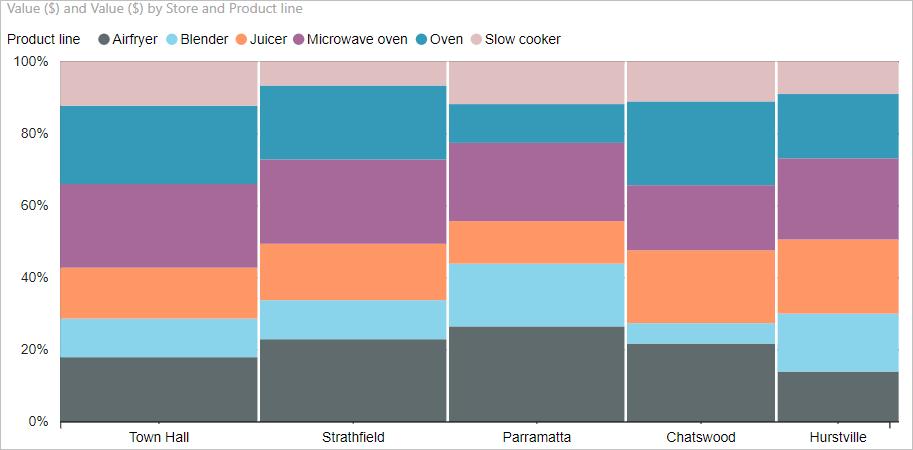
Power BI Blog: Mekko Chart
11 July 2019
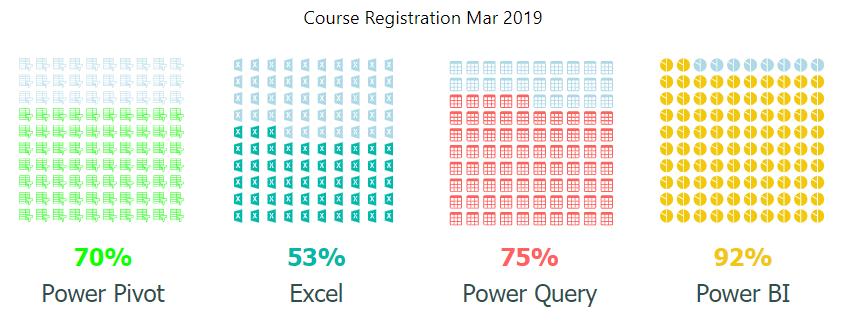
Power BI Blog: Waffle Chart (cont'd)
4 July 2019
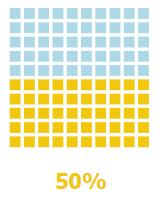
Power BI Blog: Waffle Chart
27 June 2019
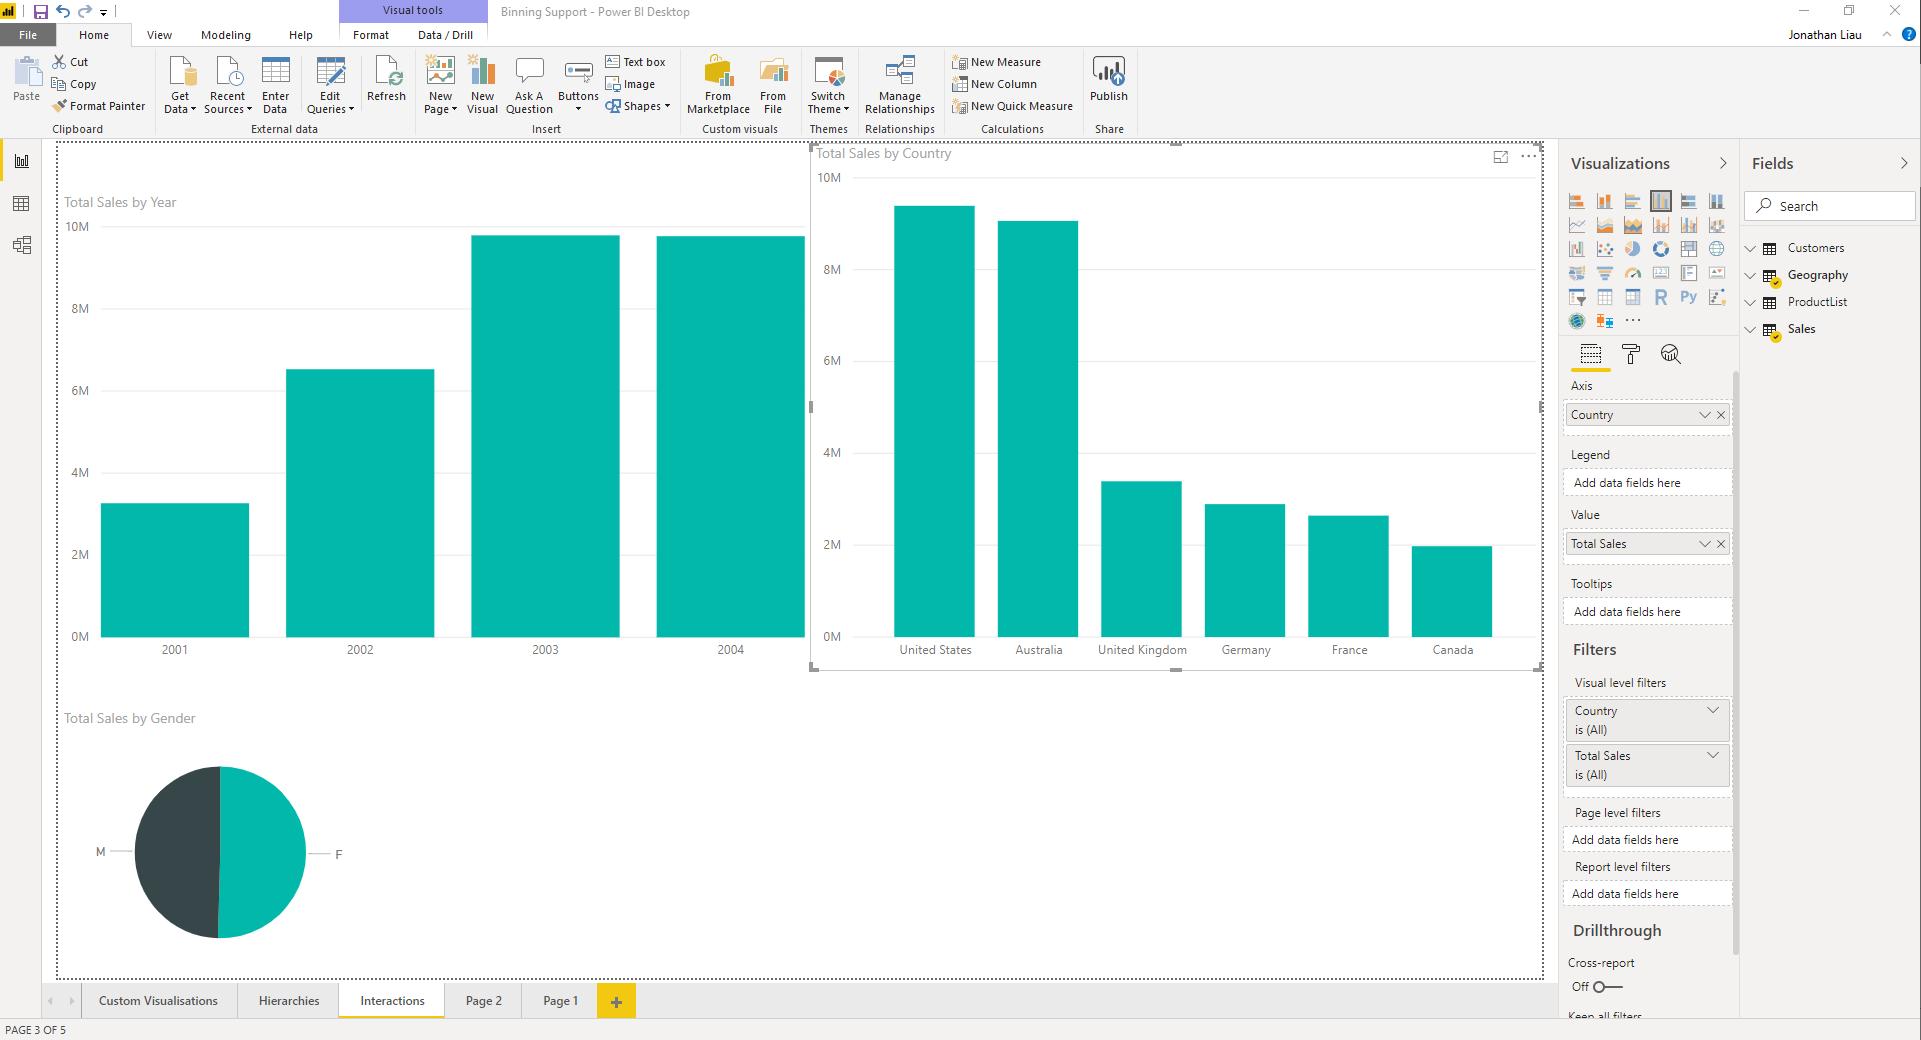
Power BI Blog: June 2019 Update New Interface
20 June 2019

Power BI Blog: Key Influencers Binning
6 June 2019
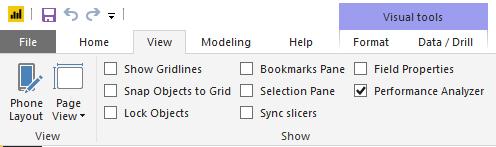
Power BI Blog: Performance Analyzer
30 May 2019
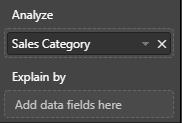
Power BI Blog: Restaurant Selector
23 May 2019
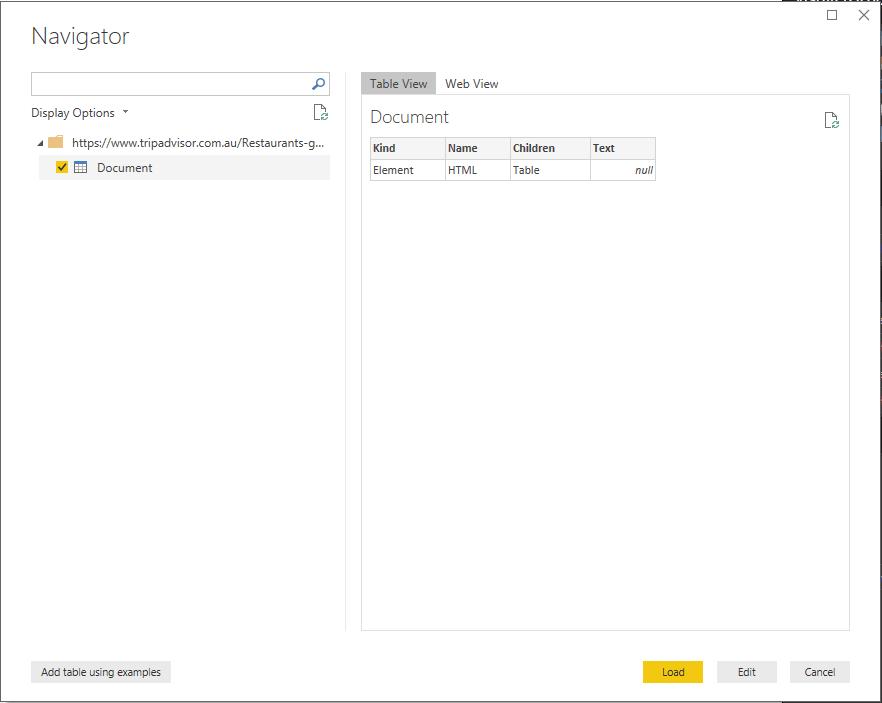
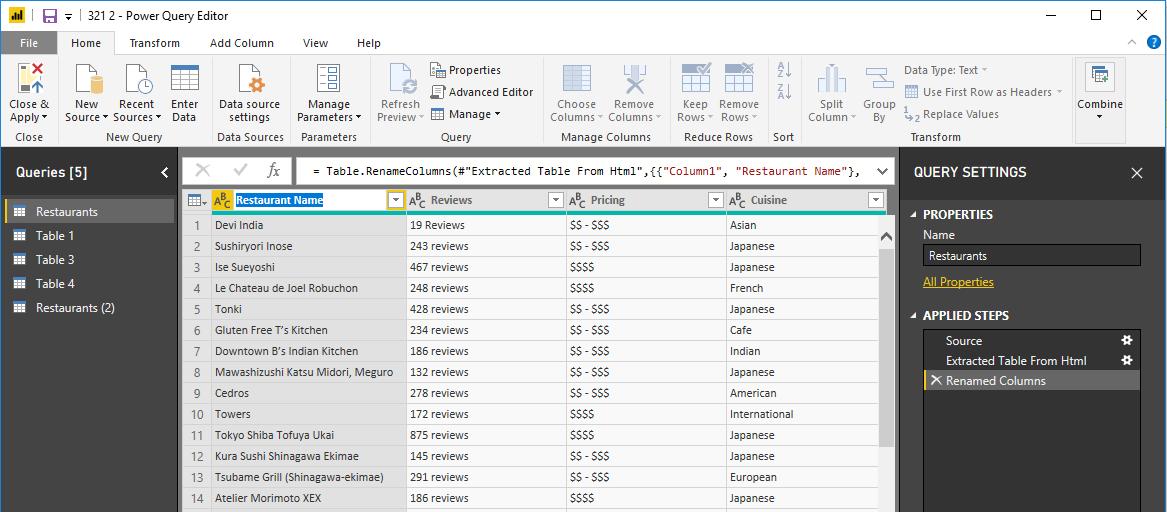
Power BI Blog: New Web Table from Inference
16 May 2019
Power BI Blog: Waterfall Charts
9 May 2019