
Power BI Blog: Key Influencers Binning
6 June 2019
Welcome back to this week’s Power BI blog series! This week, we’re going to look at Binning support for Key Influencers, a new feature that came out with Power BI’s May 2019 update.
We have talked about the Key influencers feature in a previous blog here. “Key influencers” was a relatively new feature added to Power BI early this year. In the May 2019 update they have added binning support for the key influencers visualisation. This means that we are now able to add numerical fields into the “Explain by” bucket, Power BI previously only accepted categorical fields to be placed here.
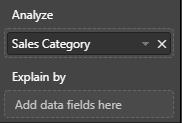
With the new update previously incompatible fields such as ‘TotalChildren’ can be placed into the Explain by bucket, and Power BI will run it’s key influencers analysis.
The numeric fields are ‘binned’ together into the most influential segments bin ranges by Power BI. Power BI also creates a column chart for us to visualise the relationships between the fields.
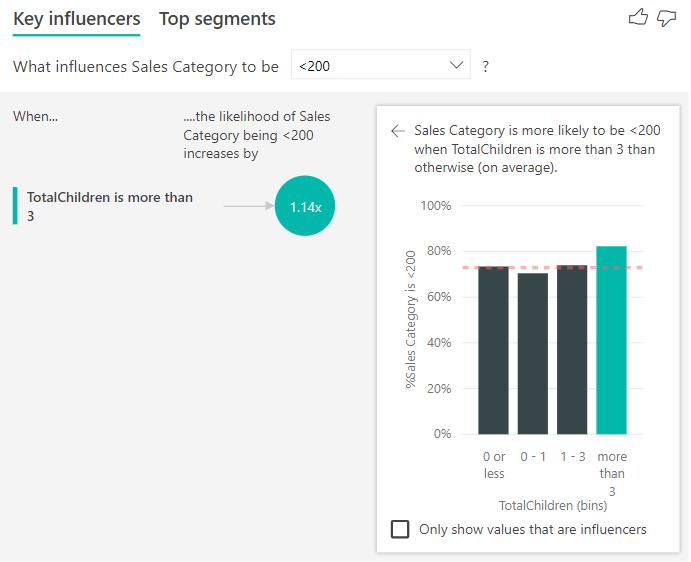
Power BI has binned the number of children each customer has into 4 bins:
- 0 children: 0 or less than zero children
- 0 - 1 children: greater than 0 or less than or equal to 1 child
- 1 - 3 children: greater than 1 and less than or equal to 3 children
- More than 3 children: greater than 3 children.
Here we can see that customers with more than 3 children are 1.14 times more likely to purchase a product that costs less than $200. Power BI has apparently also determined that some people have less than 0 children.
If Power BI detects that the relationship between the fields are linear, it will display a scatter chart visualisation instead of a bar chart.
That’s it for this week, tune in next time for more Power BI. See you then!