Please note javascript is required for full website functionality.

Blog

Charts and Dashboards: Great Gantt - Part 1

16 July 2021

Welcome back to our Charts and Dashboards blog series. This week, I look at how to create a Gantt chart.


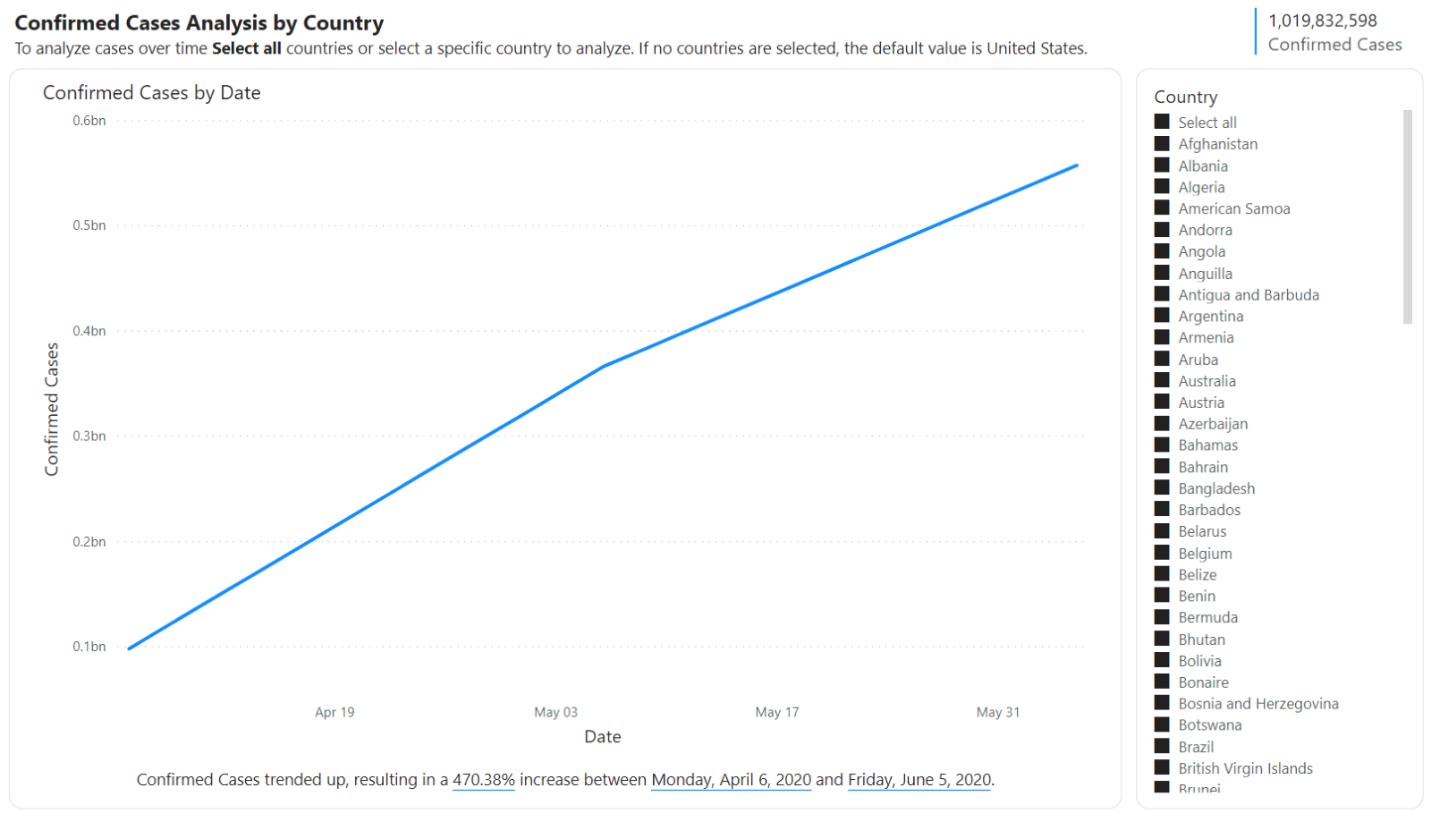
Power BI Blog: Draw a Line

15 July 2021

Welcome back to this week’s edition of the Power BI blog series. This week, we will look at how to create a line in a matrix visualisation.


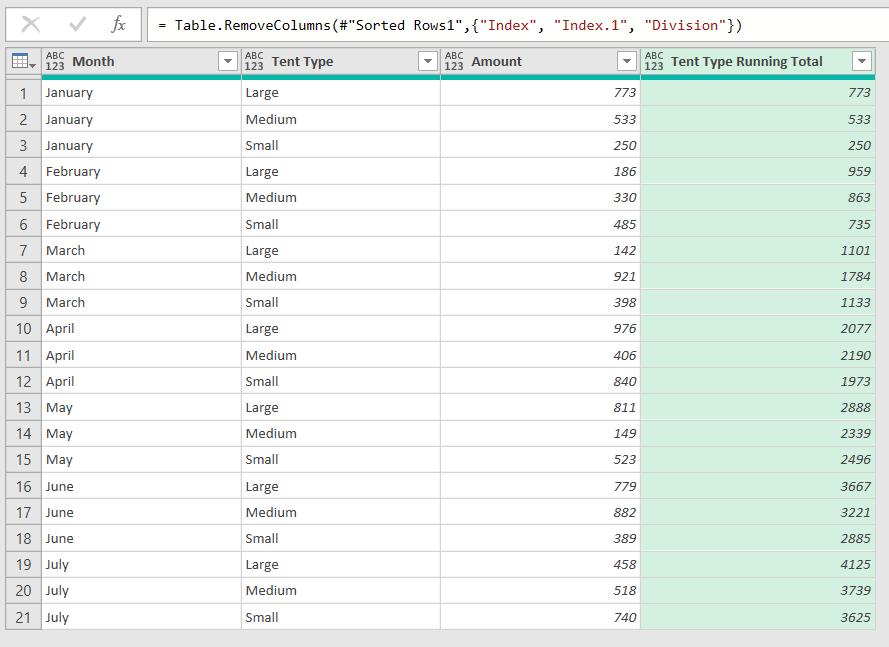
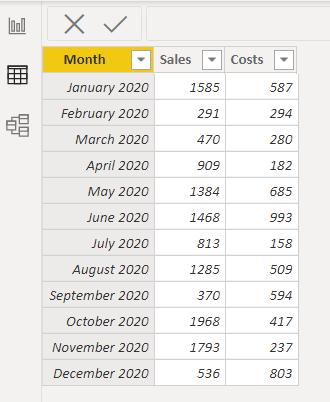
Power Query: Totals by Type

14 July 2021

Welcome to our Power Query blog. This week I look at selective running totals.


Power Pivot Principles: The A to Z of DAX Functions – ACOTH

13 July 2021

In our long-established Power Pivot Principles articles, we are starting a new series on the A to Z of Data Analysis eXpression (DAX) functions. This week it’s all a load of hyperbolics…


A to Z of Excel Functions: The ISODD Function

12 July 2021

Welcome back to our regular A to Z of Excel Functions blog. Today we look at the ISODD function.


Charts and Dashboards: Marking Milestones - Part 2

9 July 2021

Welcome back to our Charts and Dashboards blog series. This week, I continue to plot milestones on a timeline.


Power BI Blog: Select All Operation Now Supported for Dynamic M Query Parameters

8 July 2021

Welcome back to this week’s edition of the Power BI blog series. This week, we will look at the ‘Select all’ Preview feature.


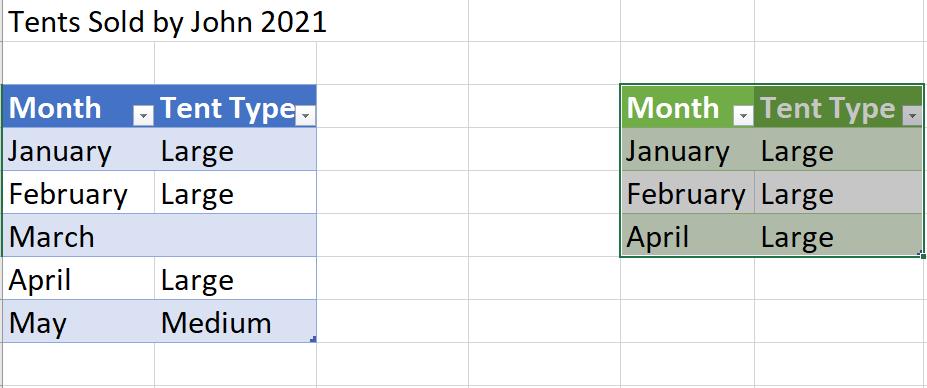
Power Query: Faulty Filtering

7 July 2021

Welcome to our Power Query blog. This week, I look at an issue with filtering.


Power Pivot Principles: The A to Z of DAX Functions – ACOT

6 July 2021

In our long-established Power Pivot Principles articles, we are starting a new series on the A to Z of Data Analysis eXpression (DAX) functions. This week it’s ACOT without a baby…


A to Z of Excel Functions: The ISO.CEILING Function

5 July 2021

Welcome back to our regular A to Z of Excel Functions blog. Today we look at the ISO.CEILING function.


Newsletter