
Power BI Blog: Power BI Report Builder – Part 4 (Creating Charts)
2 April 2020
Welcome back to this week’s edition of the Power BI blog series. This week, we look at how to create charts in the Power BI Report Builder.
For this week, let’s take a look at creating an incredibly original chart that compares each country’s sales with all others. The first thing I have to do is to create a new dataset. You can read about creating datasets in our previous blog here.
After creating the new dataset, I can generate the following query:
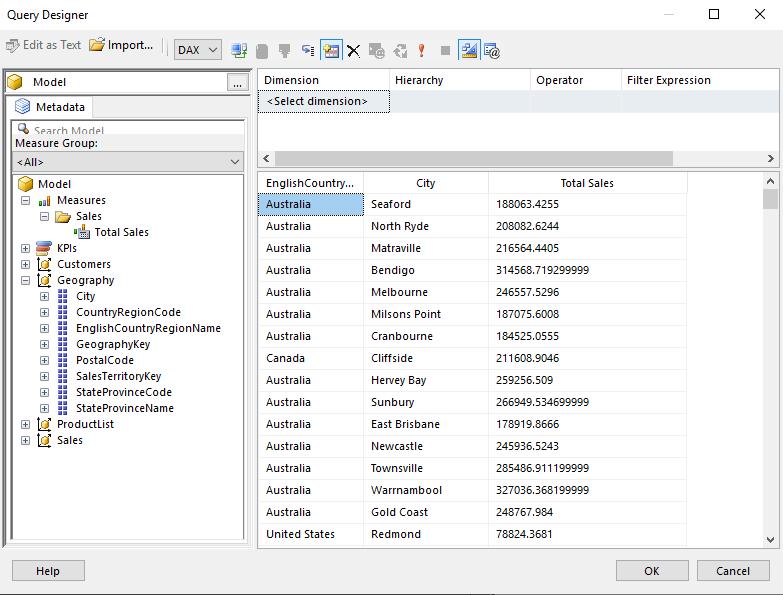
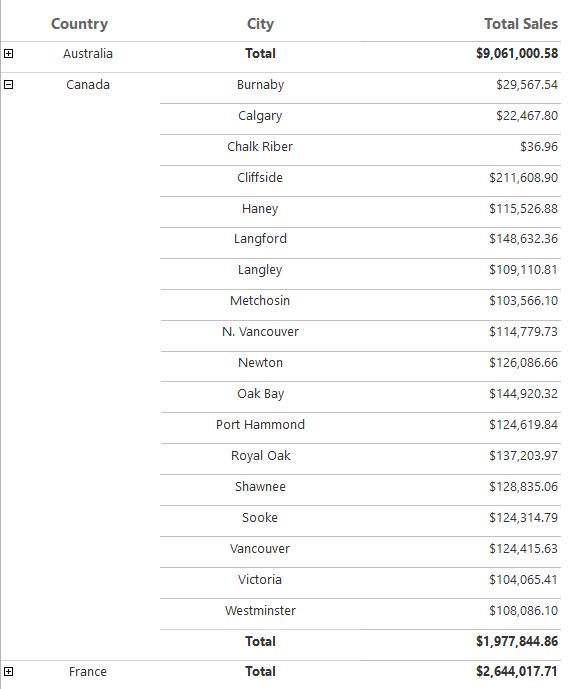
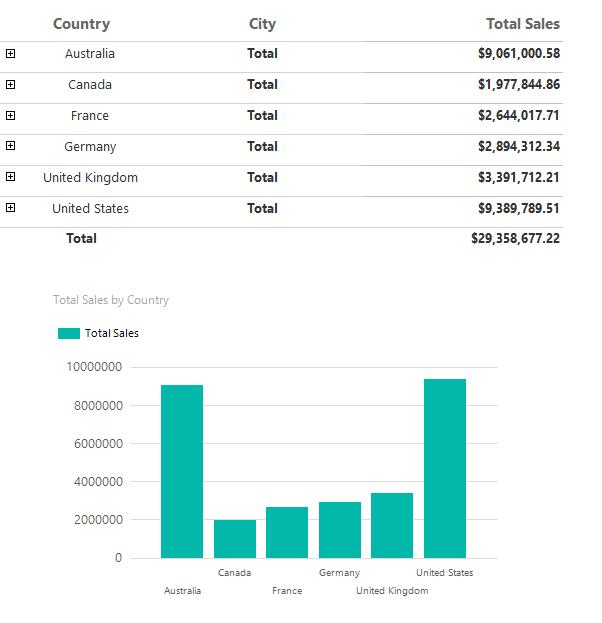
In this query, I have made sure to bring in the country and city so that I have an appropriate level of granularity. For good measure, let’s create a simple table, so that we can see our data represented numerically.
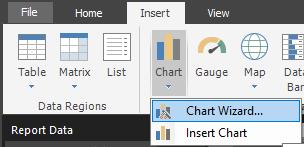
To create the chart, we navigate to the Insert tab on the Ribbon, and then click on the ‘Chart Wizard’ option from the ‘Data Visualizations’ group.
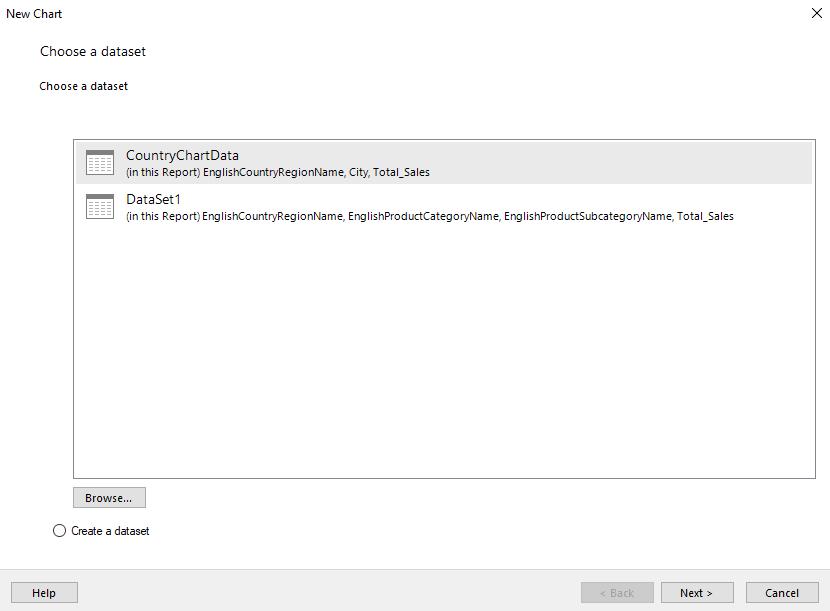
Just like the ‘Table Wizard’, the ‘Chart Wizard’ will bring up a dialog, where we are prompted to pick the dataset to use. In this case, we choose the CountryChartData dataset.
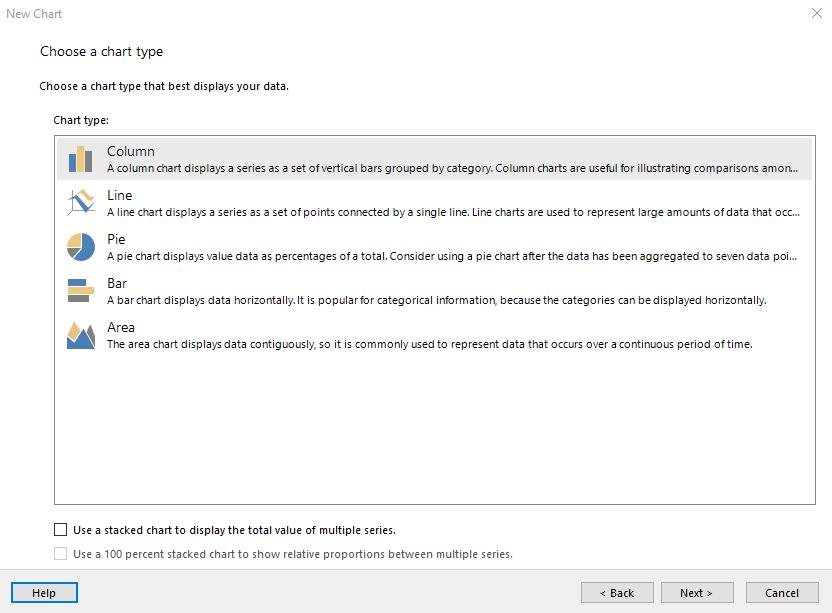
Then we have to pick a chart type. For this example, I’ve elected to use a Column chart. How original, I know…
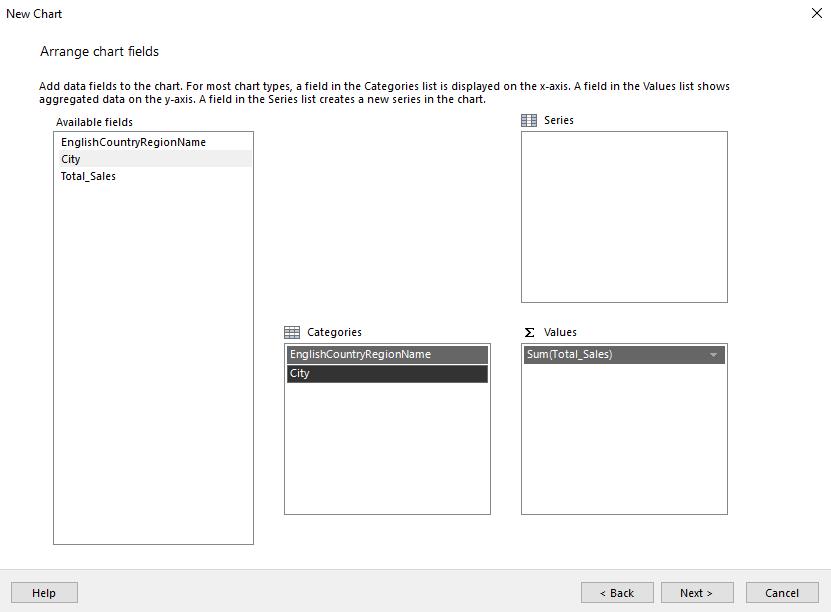
We can then arrange the chart fields appropriately. I have placed the EnglishCountryRegionName and City fields into the Categories area, and the Total_Sales measures into the Values area:
Clicking on Next will bring us to a preview page:
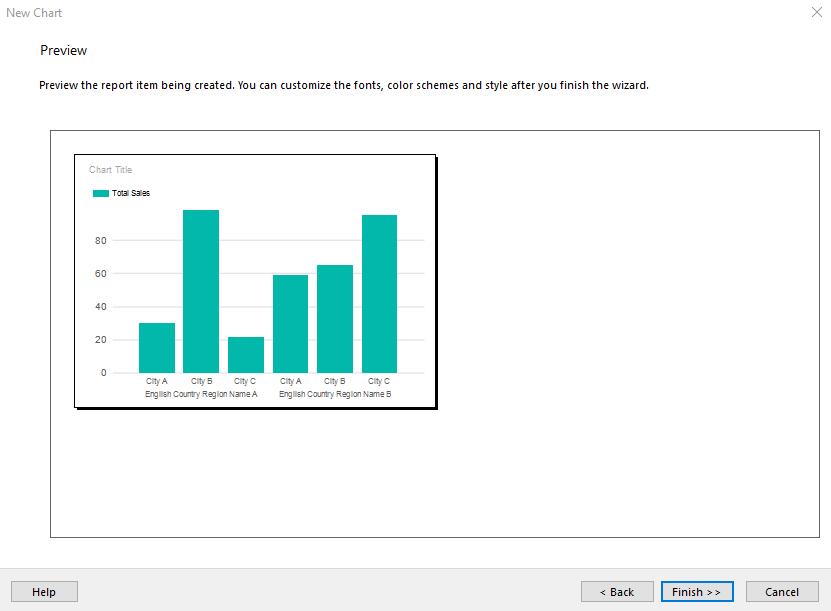
This looks good; let’s try running it.
It looks like we may have a few too many cities displayed on this chart. Perhaps we should take the City field out and think of a better way to present it. To remove the city field, go back to Design view and click on the chart:
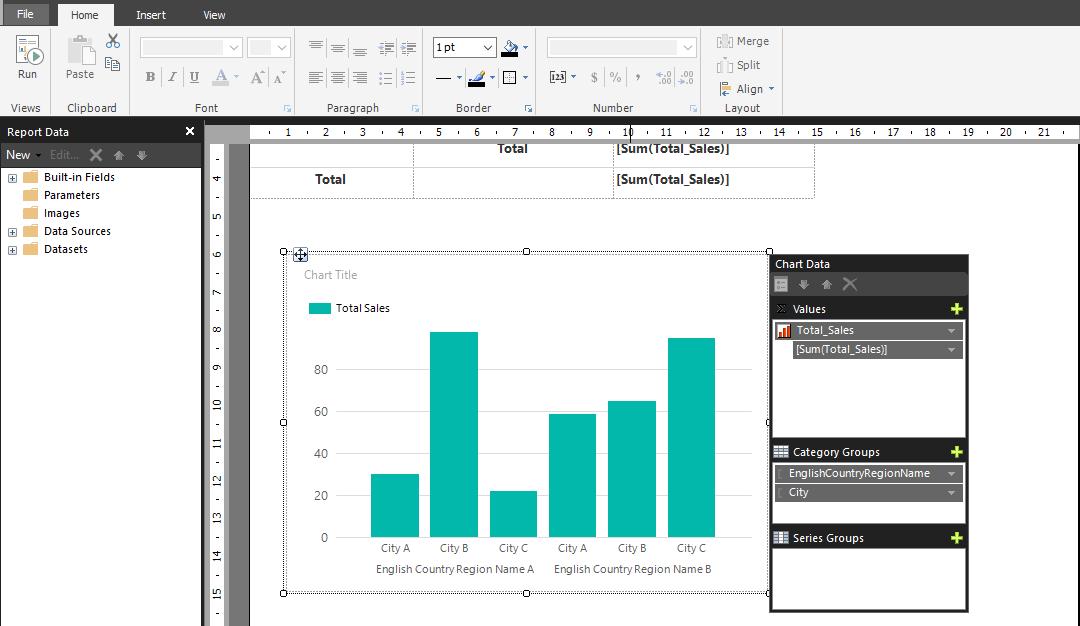
This displays a field list, similar to the one we would see in Excel. I can right-click on the City field and select ‘Delete Category Group’. I can also add a chart title by double clicking on the ‘Chart Title’ text on the chart. Now I can run it again.
That’s it for this week. Come back next week for more on the Power BI Report builder.
In the meantime, please remember we offer training in Power BI which you can find out more about here. If you wish to catch up on past articles, you can find all of our past Power BI blogs here.