
Power BI Blog: Power BI Report Builder – Part 3 (Editing Print Layouts)
26 March 2020
Welcome back to this week’s edition of the Power BI blog series. This week, we look at how to edit the print layout of tables in the Power BI Report Builder.
Last week, we looked at creating reporting tables in our Report Builder. Now let’s look at how to format them properly for printing. Apologies that we had to get to Part 3 before I was in a position to summarise what the Report Builder is actually intended for!
I want to know how my table report will look when it is printed out. I can do this by going to the Run tab on the Ribbon and choosing ‘Print Layout’:
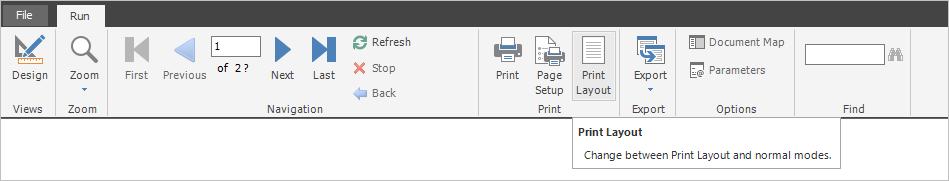
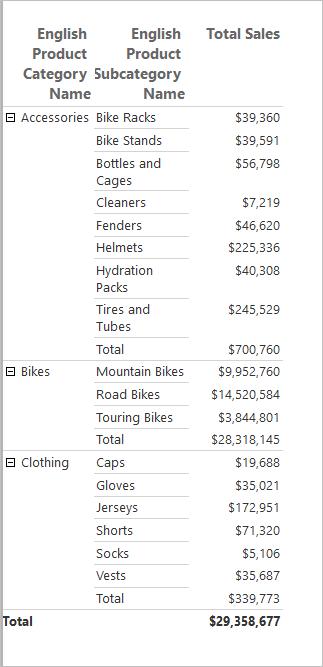
Let’s click on the ‘Print Layout’ option in the Print group on the Run tab. We get the following result:
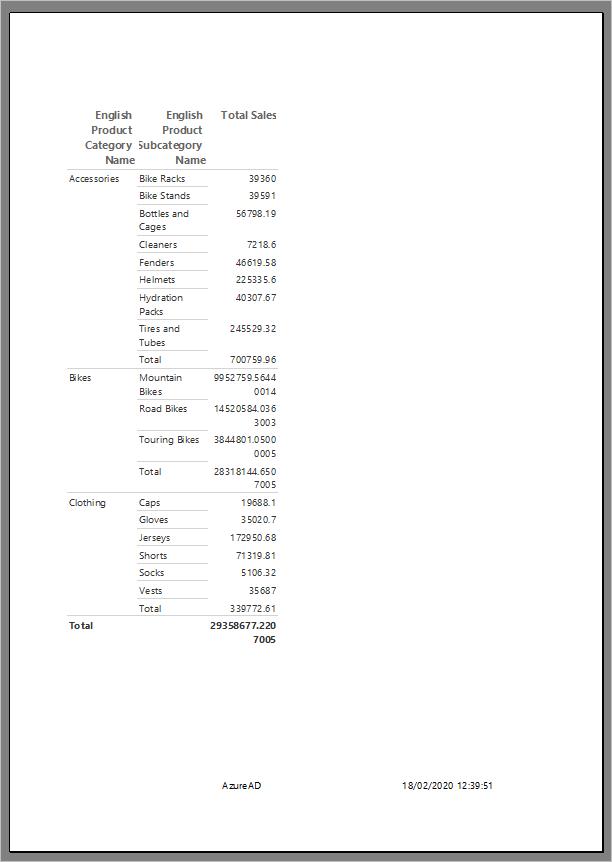
Sure, we’ve got the ‘Total Sales’ calculated correctly, and given how the table looks right now we would probably not win first prize at the annual table formatting contest. Let’s see if we can do anything about it.
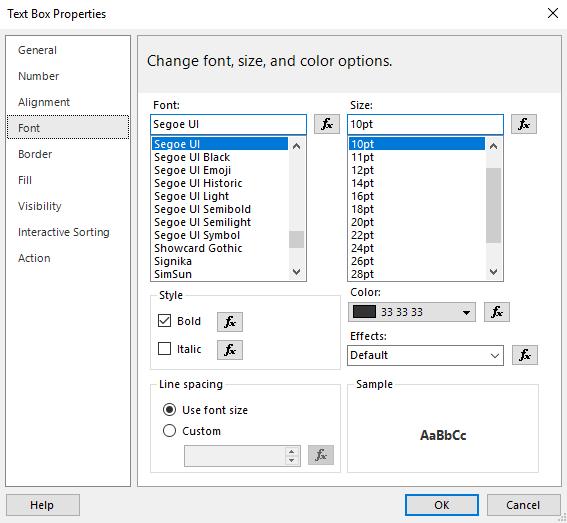
We can right-click on each element of the table and customise the formatting there. We just have to select the ‘Text Box Properties…’ option from the resulting dropdown menu:
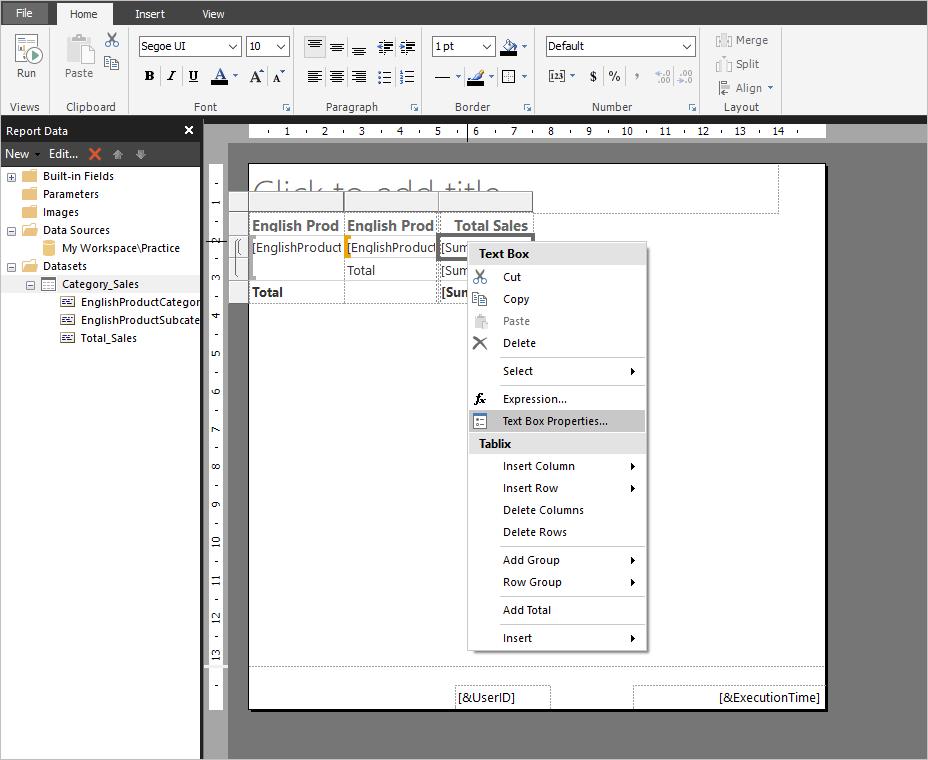
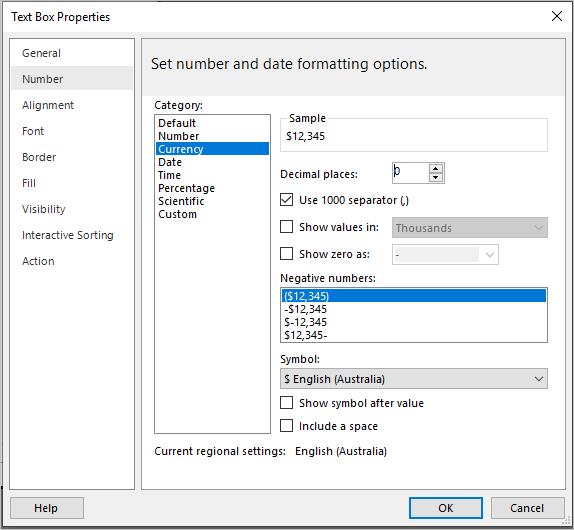
This will prompt the ‘Text Box Properties’ dialog to appear. This looks very similar to the properties dialogs encountered in Excel:
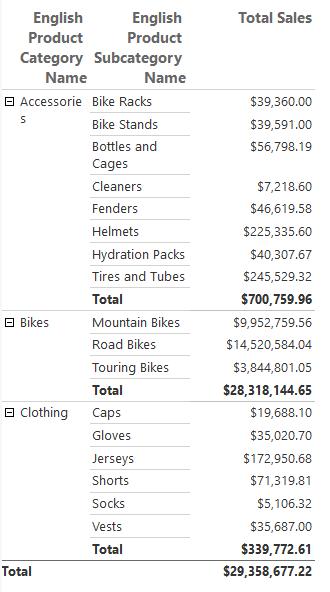
After applying some formatting changes to our table I’ve managed to make it look like this:
Nothing special, probably just a runner-up in the table formatting competition at best. I want to make the total(s) bold and insert lines after each total amount. Click on the ‘[Sum(Total_Sales)]’ cell, or in this case, the text box. Embolden the cell in the ‘Text Box Properties’ dialog and insert a border on the top of the cell.
I have also inserted top borders on the totals for each product category too.
The second column header, ‘English Product Subcategory Name’, and some categories in the first column are still somewhat obscured. I can drag the table out just like I would in Excel so that the headers would have more space. While I’m doing this, I should also rename the column headings, by double-clicking on the cell and renaming it:
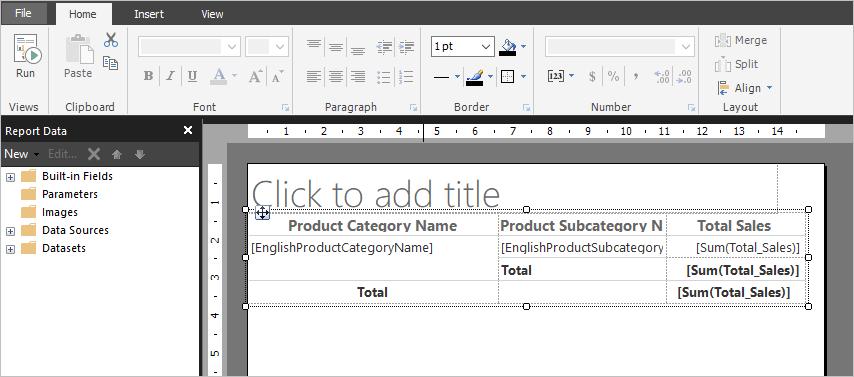
Let’s click Run this time and see what we get:
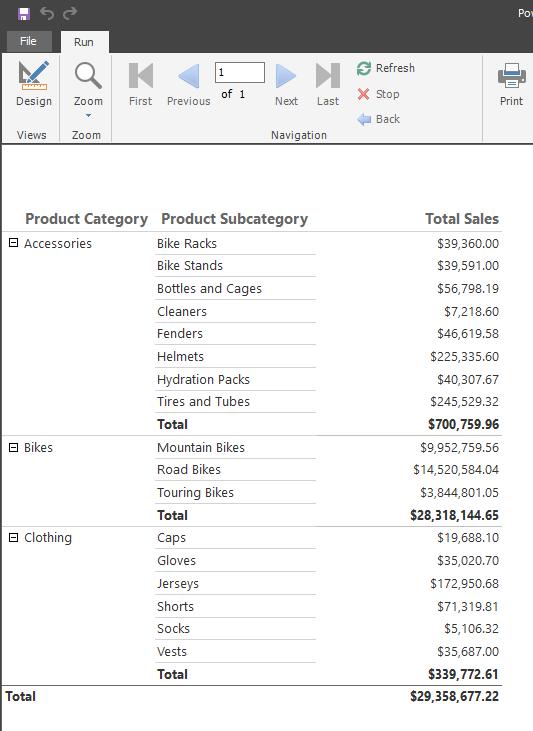
Now that’s a first-place contender right there…
That’s it for this week. Come back next week for more on the Power BI Report builder.
In the meantime, please remember we offer training in Power BI which you can find out more about here. If you wish to catch up on past articles, you can find all of our past Power BI blogs here.