
Power BI Blog: Custom Visuals – the Hierarchy Tree Advanced Editor
27 February 2020
Welcome back to this week’s Power BI blog series. This week, we take an even deeper look at the Hierarchy Tree visualisation.
This week we will cover some other features in the Hierarchy Tree visualisation.
As a quick recap, this is the resulting visual we produced by the end of last week’s blog:
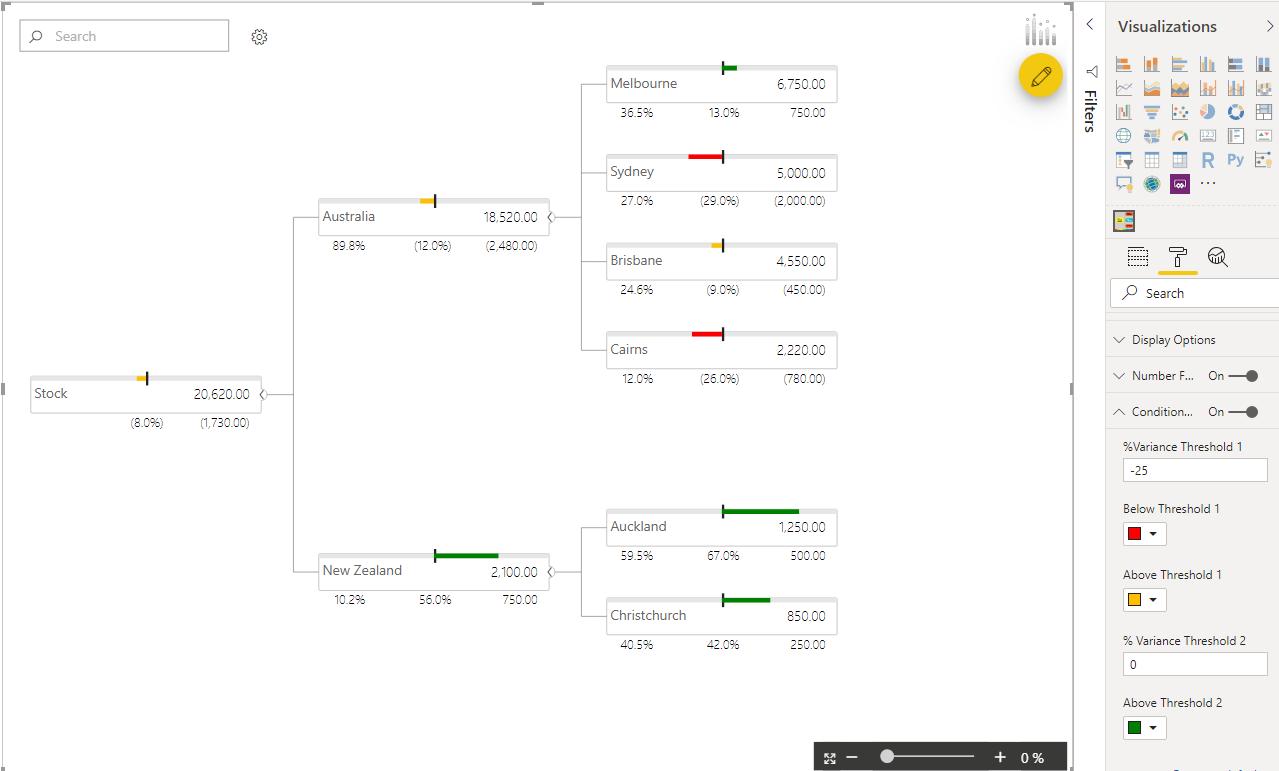
We set some conditional formatting rules so that the progress bars, on top of each node, display how much the actual amounts vary compared to the budgeted amounts.
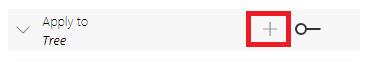
Throughout this short series, you may have noticed the yellow button on the top right-hand corner of the visualisation.
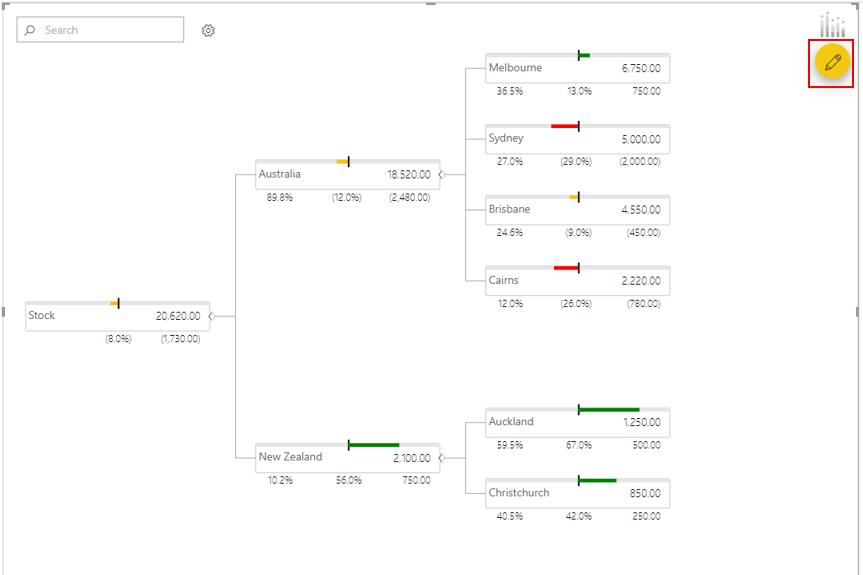
This button opens the ‘Advanced Editor’, which allows us to apply another level of conditional formatting to the nodes. This level of conditional formatting will apply to the background or font colour of the nodes.
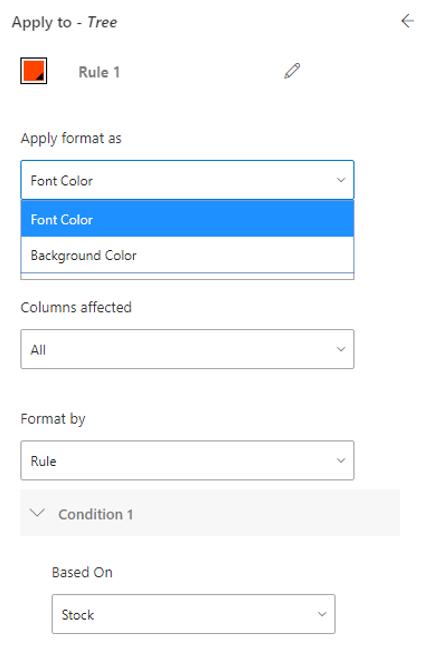
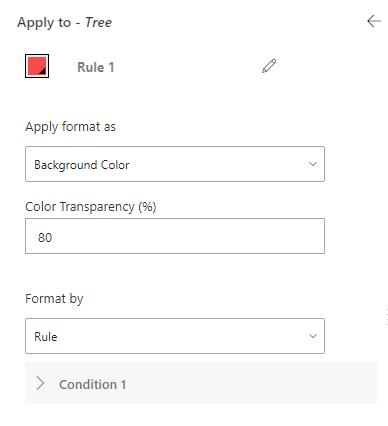
For this example, we will use the background colour option.
To create a conditional formatting rule, we simply add a conditional formatting rule from the left pane.
I have elected to use the following settings to further highlight if a node is under budget:
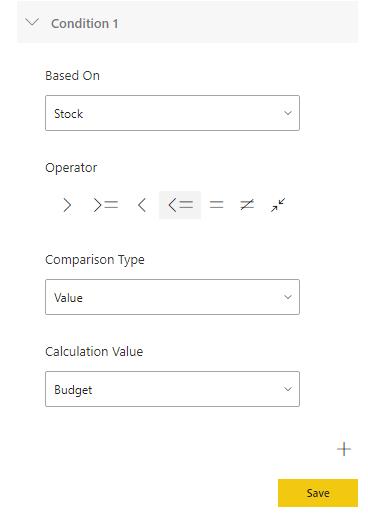
Now we have to specify the condition rules, so I will click on the ‘Condition 1’ option:
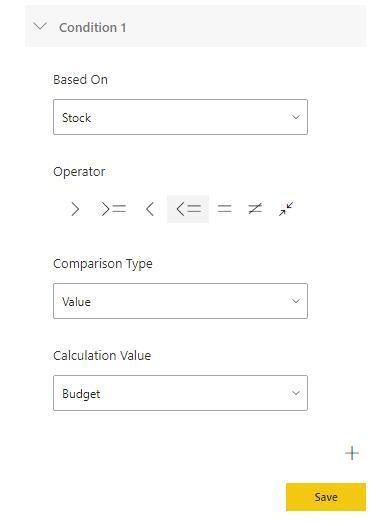
I have elected to base this conditional formatting rule on the stock amounts. The drop-down option here allows me to pick from all of the fields in the current dataset. I have then selected the less than or equal to option. The next step is to pick the ‘Comparison Type’:
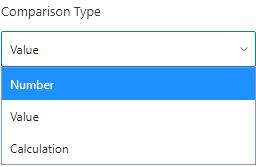
There are various types:
- the Number option will allow me to compare every node stock value to a set number that is manually entered
- the Value option allows me to compare the node stock values to another field in my dataset
- the Calculation option allows me to compare the node stock values to a simple calculation (simple calculation example pictured below):
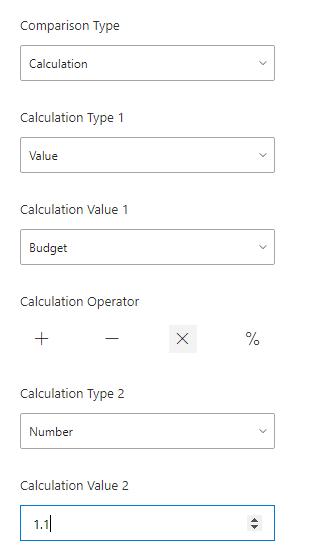
For this example, we will just compare the Stock values to the Budget values, viz.
As a side note, we can add more conditions to this rule with the ‘+’ option at the bottom.
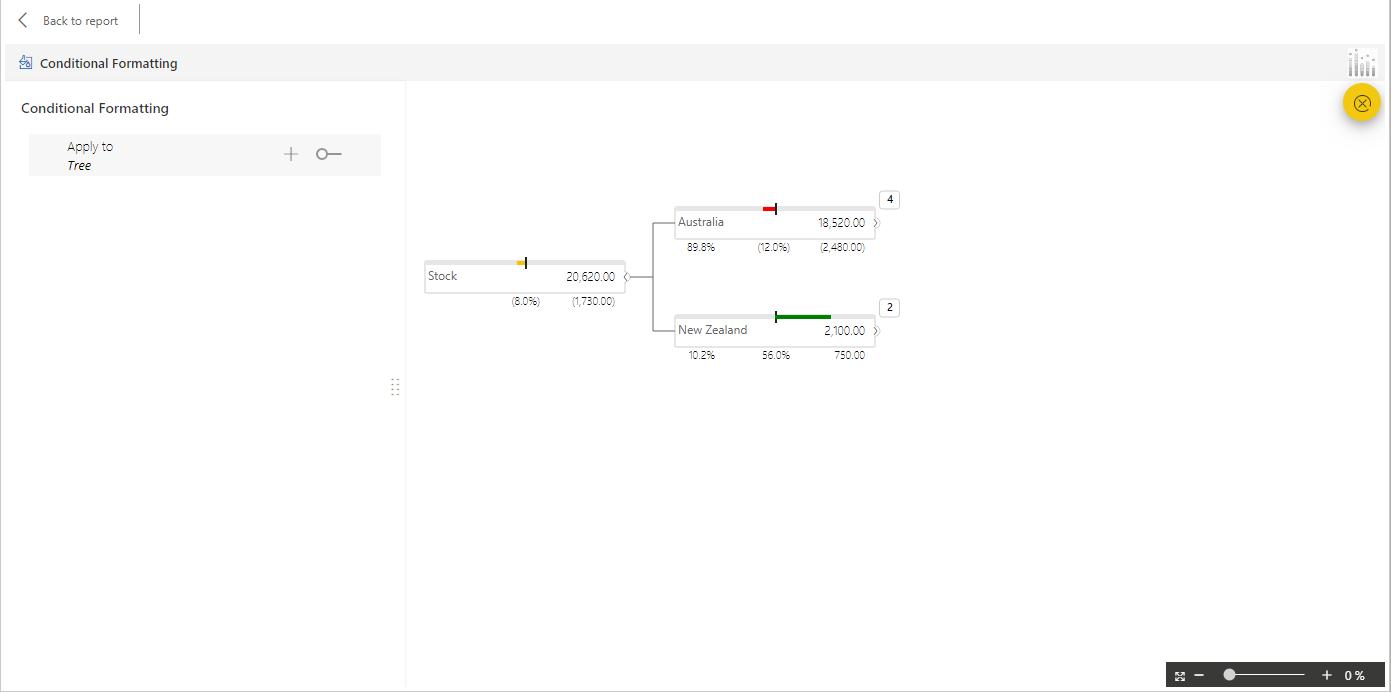
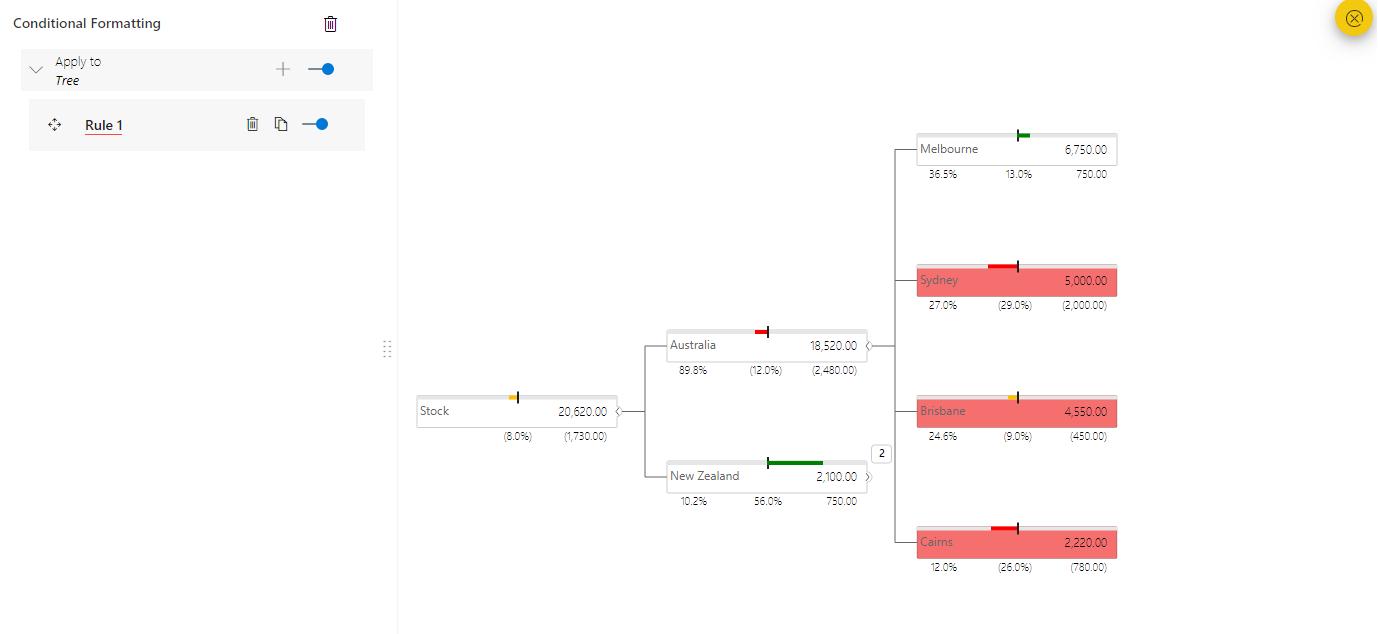
Next, I press Save and the resulting changes should look like this:
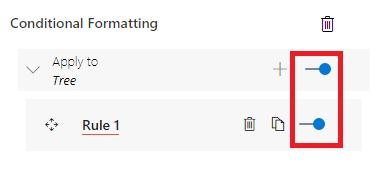
With multiple rules we can enable and disable rules with the ‘off and on’ toggles on the right of each rule:
That’s it for this week, check back next week for the next week for more Power BI!
In the meantime, please remember we offer training in Power BI which you can find out more about here. If you wish to catch up on past articles, you can find all of our past Power BI blogs here.