
Charts and Dashboards: The Bubble Pie Chart - Part 2
1 September 2023
Welcome back to our Charts and Dashboards blog series. This week, we’re going to continue constructing our Bubble Pie chart.
The Bubble Pie chart
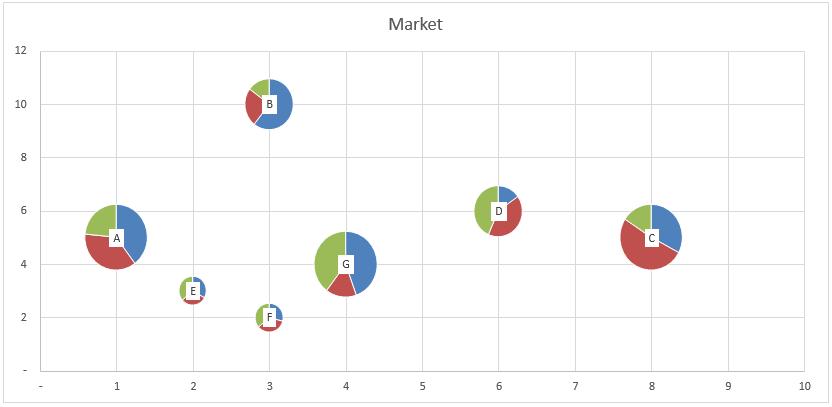
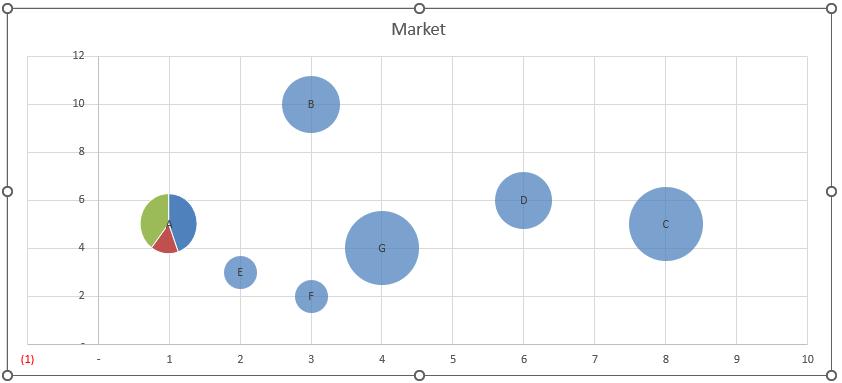
Last week we started to look at how to construct a chart that might look like the following:
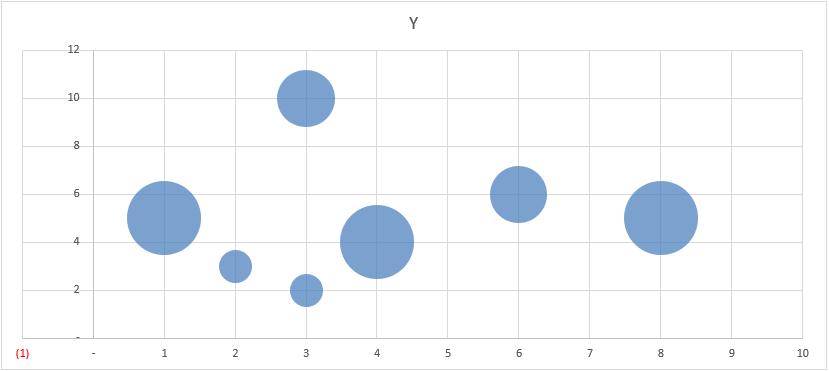
We began with this Excel file here. From the data within this workbook, we created a Bubble chart:
Next, we created a Pie chart for Market A only, removing the title, legend and making the chart area transparent, removing the border as well.
The reason we did this was so that we may copy and paste this Pie chart as a picture on to the Market A Bubble. Hence, we want to make the Pie chart as “clean” as possible. At this stage, we can now copy this Pie chart as a picture, so we select the chart and select Copy -> Copy as Picture (for some older versions of Excel you may need to hold down SHIFT and click Edit Menu to ‘Copy as picture’):

This will bring up the ‘Copy Picture’ dialog as follows:

We simply press OK at this stage, and it will copy the picture. Before we paste this into our Bubble chart, we will need to label the bubbles so that we can identify the correct bubble for each pie chart. Thus, we select the Bubble Chart and select Chart Design -> Add Chart Element -> Data Label -> More Data Label Options:

This allows us access to the ‘Format Data Labels’ pane, within which we will choose the ‘Label Options’:
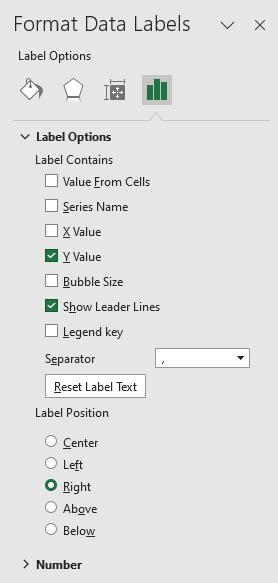
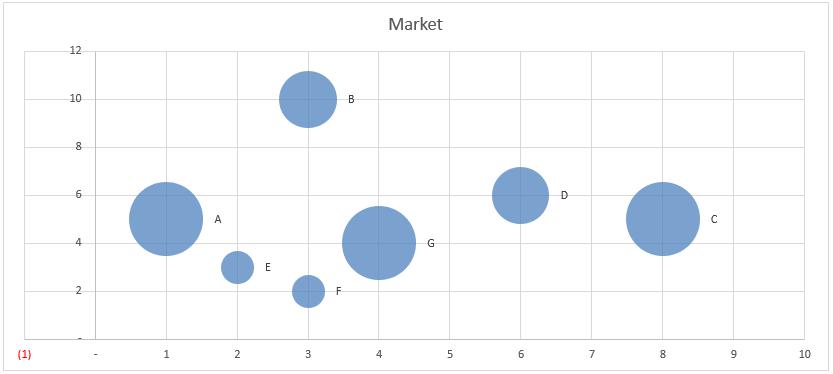
We will untick ‘Y Value’ and ‘Show Leader Lines’ here and instead tick ‘Value From Cells’. For the inputs within the pop-up dialog box, we will select the Market column of the Data table:
If we want to centre the label, we will choose the ‘Center’ (sic) option here:

We now have labels and we can safely paste the picture onto the correct Bubble. We simply double click on the Market A Bubble then press CTRL + V (if this does not work, you may need to reperform the copy step). We now have a Pie for one Bubble:
We can populate the other Bubbles with images by making a Pie chart for each Bubble and copying and pasting them to the correct Bubble. However, this could be quite an arduous process. Join us next week when we take a look at using VBA to automate this process.
That’s it for this week. Come back next week for more Charts and Dashboards tips.