
Charts and Dashboards: Data Tables - Part 3
10 June 2022
Welcome back to our Charts and Dashboards blog series. This week, we’ll take a look at two-dimensional Data Tables.
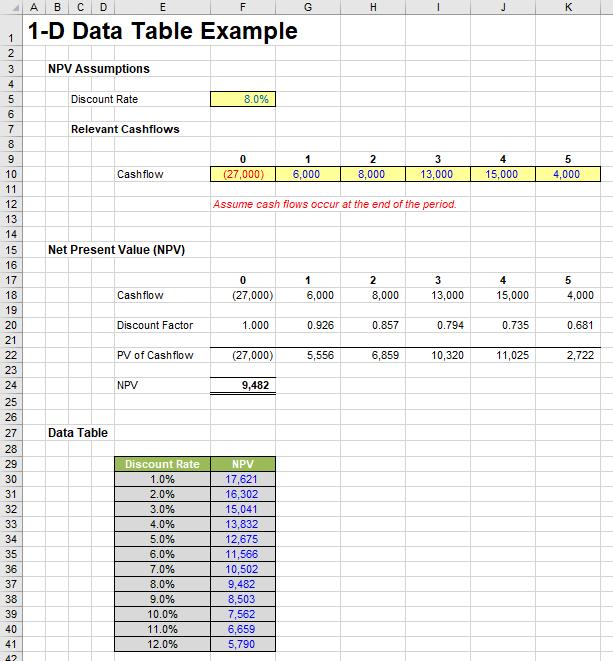
Last week, we constructed the below 1-D Data Table:
This week, we’ll instead consider 2-D Data Tables. These Data Tables are similar in idea: they simply allow for two inputs to be varied at the same time. Let’s extend the 1-D example as follows:
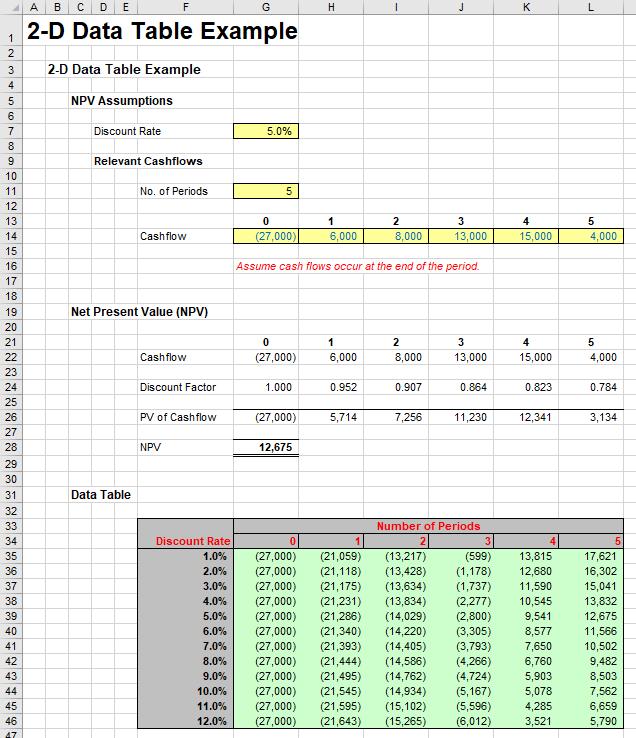
This example is similar, but only calculates the NPV for a certain number of periods – specified in cell G11. Our 2-D Data Table (which is cells F34:L46, not F33:L46) can answer the question, “What is the NPV of our project over x periods with a discount rate of y%?”.
If anything, a 2-D Data Table is simpler than its 1-D counterpart since there is little confusion over row and column input cells. Again, the output needs to be in the table, this time it must be in the top left-hand corner of the array. In our example, it is disguised as “Discount Rate” using similar number formatting to that described last week.
The inputs required now form the remainder of the top row and the first column of the Data Table. With cells F34:L46 highlighted, the Data Table dialog box is opened as before:
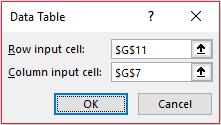
Since the top row are the inputs for the Number of Periods, the ‘Row input cell:’ should reference $G$11, whilst the discount rate inputs (‘Column input cell:’) should link to $G$7 once more.
Once ‘OK’ is clicked, the Data Table will populate as required – simple!
That’s it for this week. Come back next week for more Charts and Dashboards tips.