
Charts and Dashboards: Chart Titles as a Text Box Revisited
2 September 2022
Welcome back to this week’s Charts and Dashboards blog series. This week, we revisit creating attention grabbing chart titles.
One way to make the chart more unique is to emphasize it with a text box chart title which is straightforward to create a text box in Excel. We covered this in Chart Titles as a Text Box.
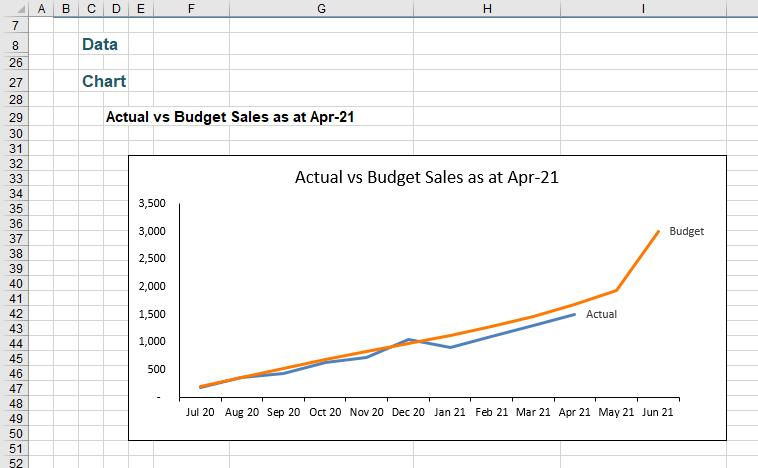
In our original blog, we had a line chart with a chart title in cell D29:
We created a text box by inserting a rectangle and linking it to D29. To attach the chart title text box to the chart, we clicked on the text box, held the CTRL key and clicked on the chart, then right-clicked, to Group.
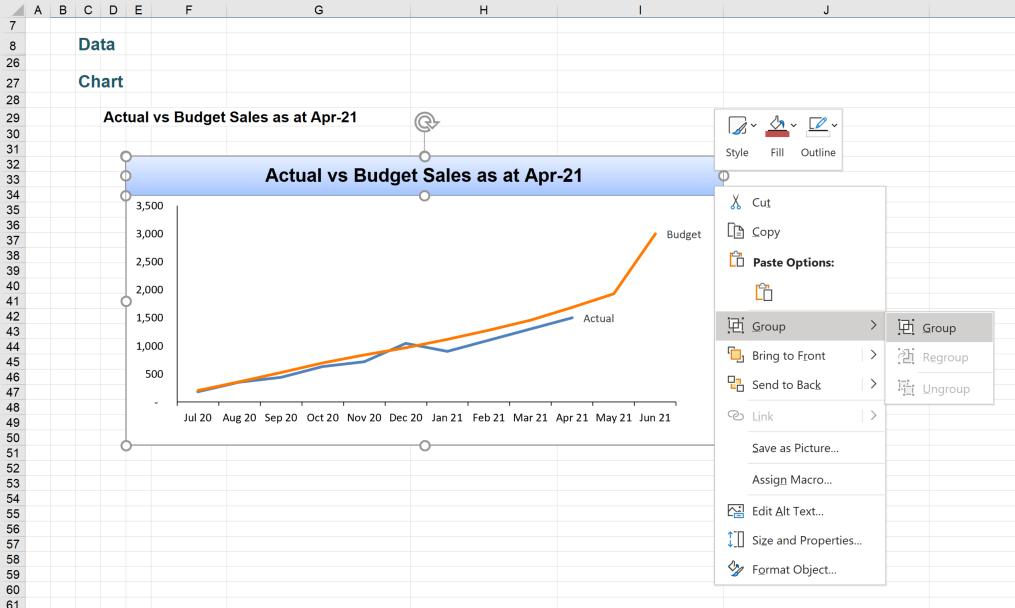
This ensured that the chart and the text box stuck to each other and moved together.
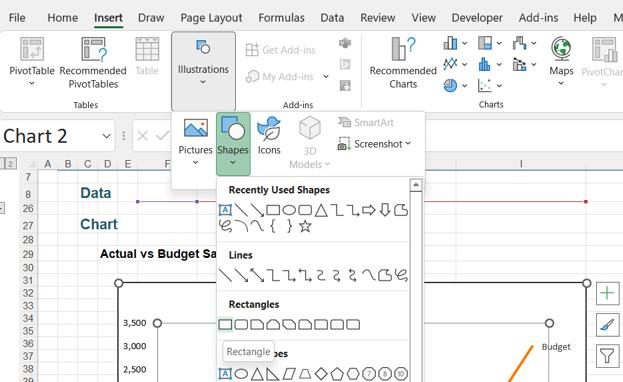
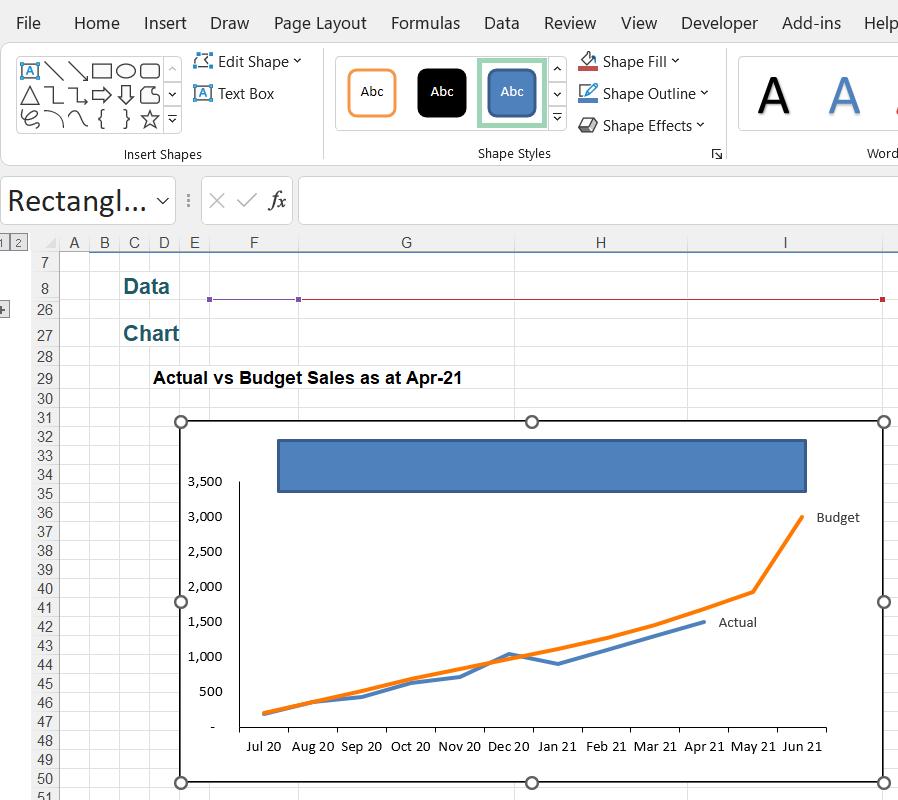
We could have approached this another way. We will start with the same chart. This time however, we select the chart first. As before, we select a rectangle from the Shapes dropdown in the Illustrations section of the Insert tab:
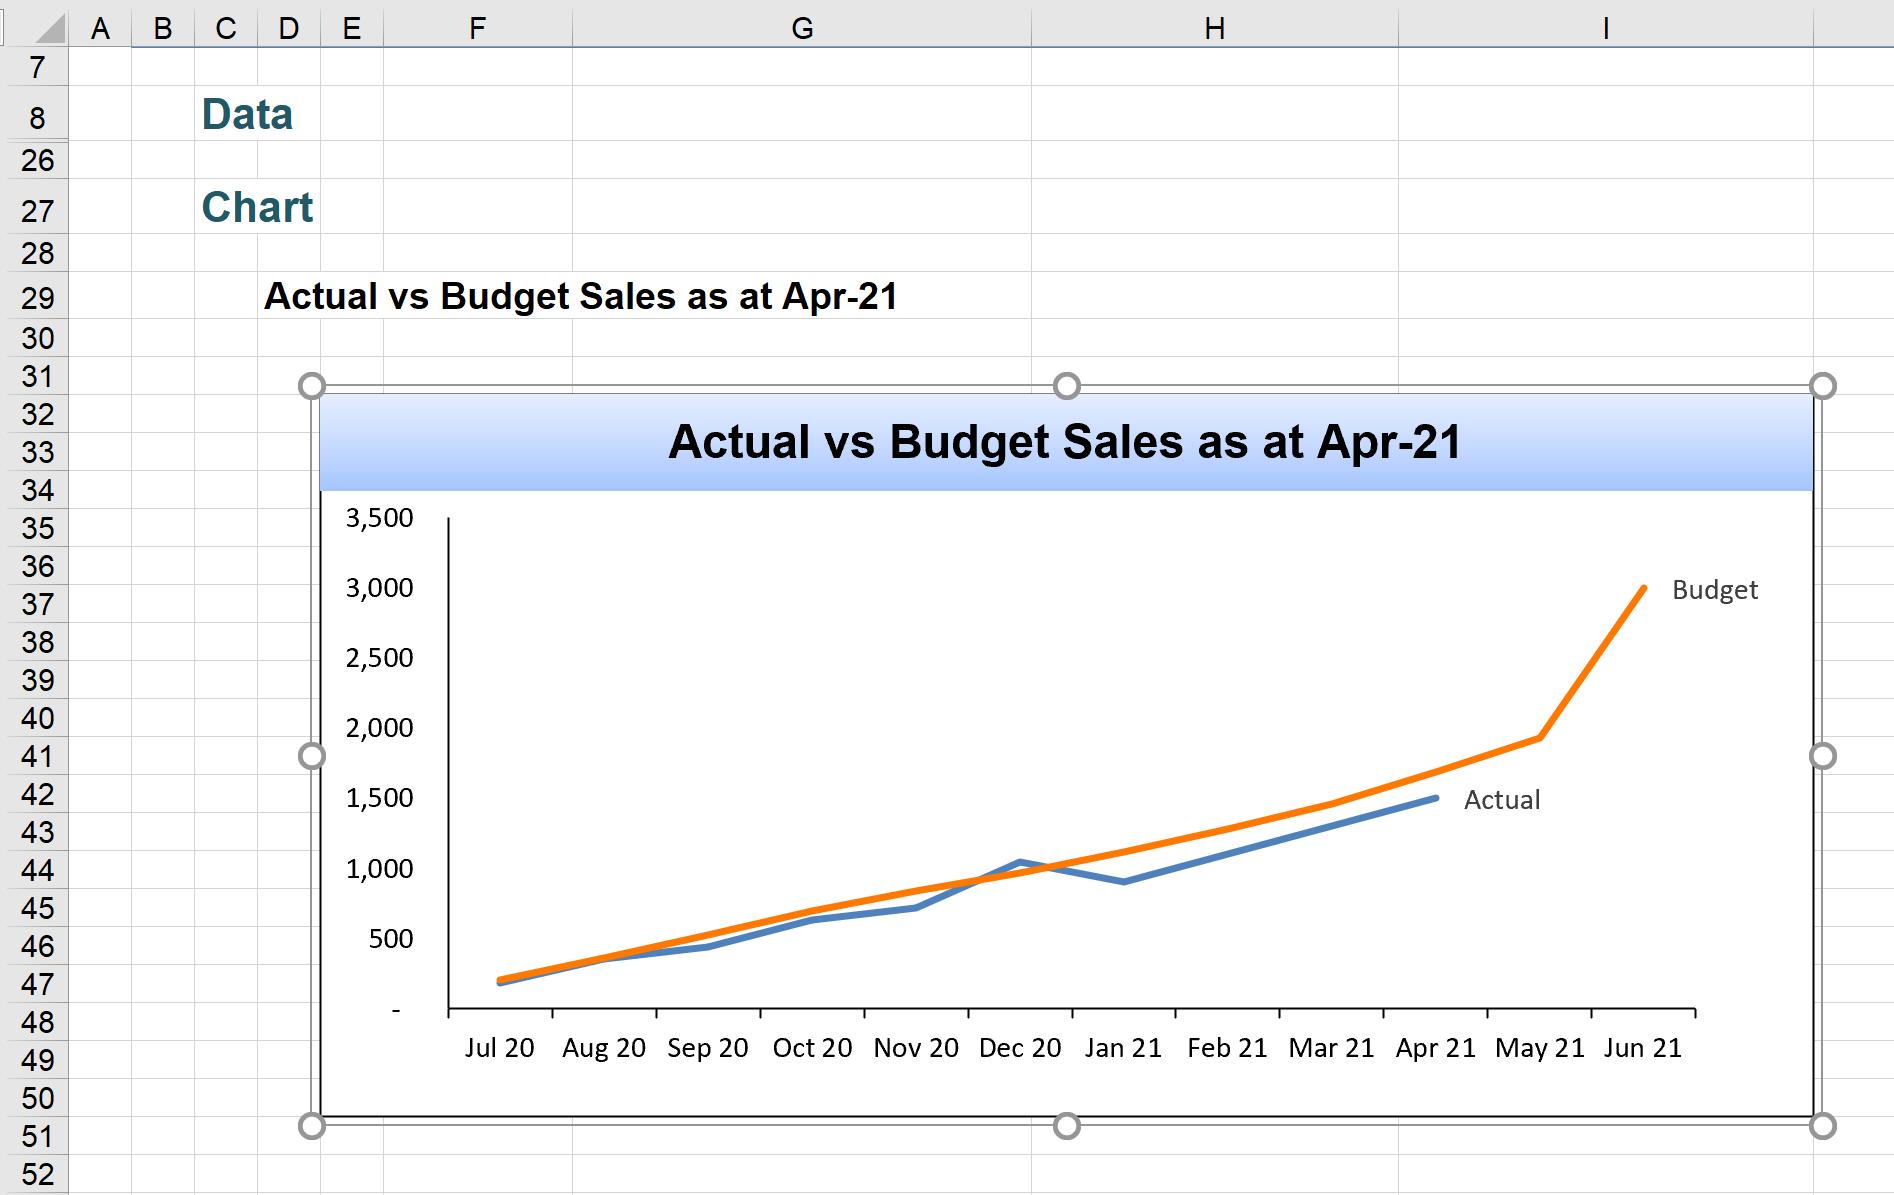
This way, we create the rectangle inside the chart.
We can then link the rectangle to the cell with the title:
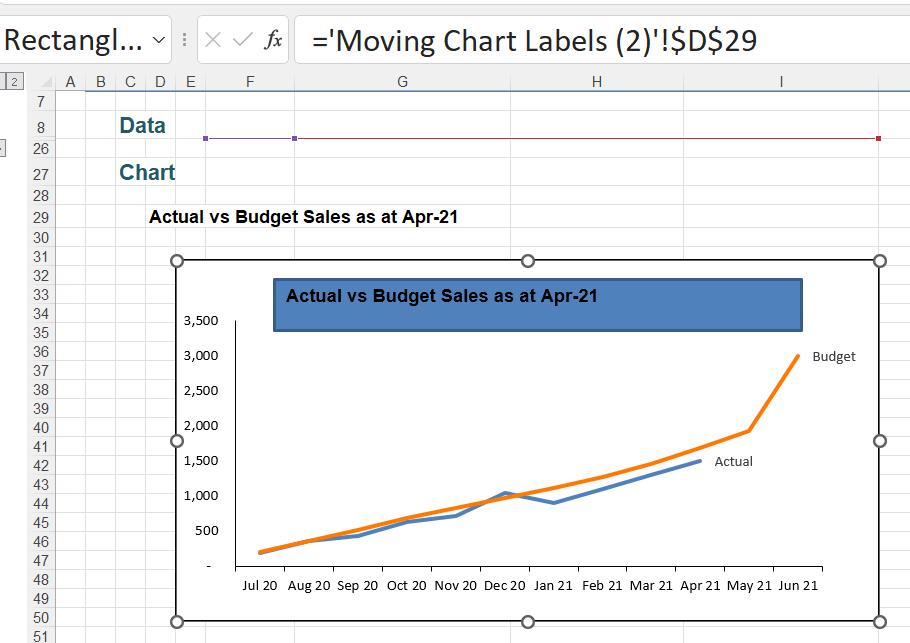
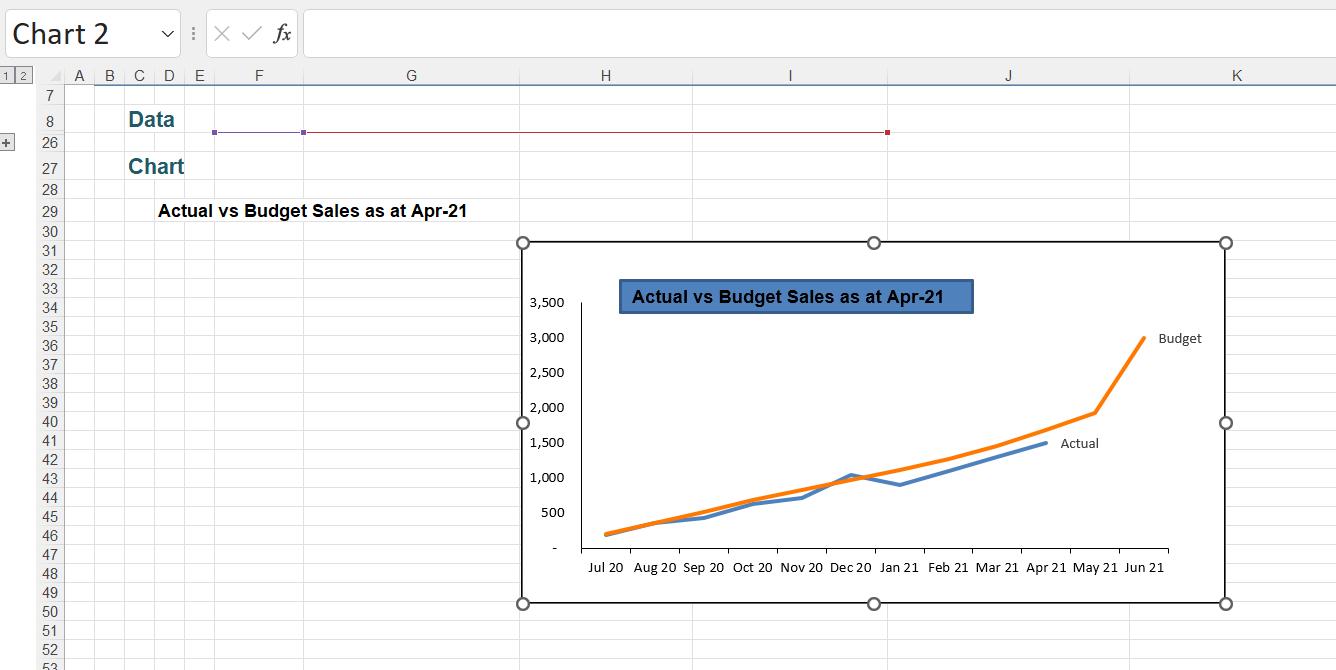
We can then resize the rectangle. When we move the chart, the rectangle moves with it, with no requirement to group the objects because it is already part of the chart.
That’s it for this week. Come back next week for more Charts and Dashboards tips.