
Charts and Dashboards: Dashboard Workbook Layout – Part 3
18 September 2020
Welcome back to this week’s Charts and Dashboards blog series. This week, we will continue to talk about the dashboard design.
In Part 2, we talked about the five criteria to consider when designing a dashboard, being:
- the granularity
- level of information required
- timescales
- leading and lagging metrics
- decision making required.
We also looked at two dashboard examples, one was bad, one was better. A good dashboard should be able to answer the frequently asked business questions at a glance. This essentially means that the end user should be able to pick out the information they need from the dashboard within a few seconds, or at least know where to look for the information they need within that time frame. If the end user is spending minutes scanning for that information, there is a problem with the dashboard design.
Thus, when designing a dashboard, we should endeavour to follow the five-second rule. Five seconds is roughly how much time the end user should need to find the information they are looking for when examining the dashboard. Of course, deeper analysis or investigation is expected to take longer than five seconds, but the most important metrics should stand out to the user.
For example, we have a sales manager who needs to send the sales performances to the senior management:
- the income by customer by type and the utilisation
- the monthly income by customer.
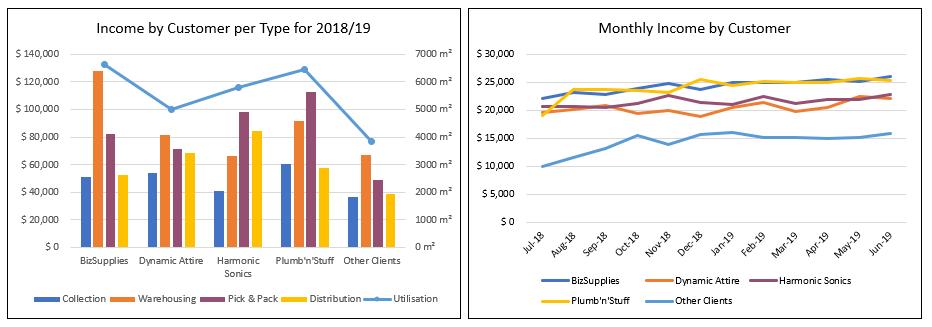
All of the requested metrics are displayed neatly in one dashboard. Most of the information they requested can be easily found within five seconds.
The best way to explain this is through a scenario.
In our example, sales data is categorised into five customer groups, namely BizSupplies, Dynamic Attire, Harmonic Sonics, Plumb’n’Stuff and Other Clients, and into four types, being Collection, Warehousing, Pick&Pack and Distribution. The sales staff should have a collection of 60-70 well maintained and updated charts / chart data that measure various possible metrics, operation indicators and business unit indices. This is akin to cockpit reporting, where in an aeroplane, various instruments keep track of all key outputs, although some are irrelevant at particular times (e.g. de-icer settings are possibly not essential information for landing).
For each division, each reporting period, they will create a report, probably referred to as a dashboard. This report may contain charts that highlight potential issues now or in the future, as well as multitudes of other charts that reflect that the business is doing just fine. When compiling reports for the board, be it monthly, quarterly or yearly, the analysts will sift through the cockpit reporting data. They would look for any charts that highlight any areas of concern now, or in the near future; ignoring charts that do not show any issues. These charts are compiled and put into a reporting dashboard.
The report(ing dashboard) will then be comprised of, says, six to nine charts that will highlight to the board any issues within the company that they have to address. Hence, the analogy to the cockpit dashboard, where it is a collection of all the potential charts that an analyst has to look over. The analyst focuses on the charts that raises concern into a reporting dashboard for senior management to address.
At a business level, they key points from each division will be reported. This is referred to in different software as the (overall) dashboard. Data may come from many sources and not pertain to one particular product, service, business unit or division.

That’s it for this week, check back next week for more Charts and Dashboards tips.