Blog
Power Query: Fabulously Fiddly Fill Down
15 July 2020
A to Z of Excel Functions: The ARRAYTOTEXT Function
13 July 2020

A to Z of Excel Functions: The IMCONJUGATE Function
13 July 2020
Charts and Dashboards: Dynamic Charts – Part 2
10 July 2020
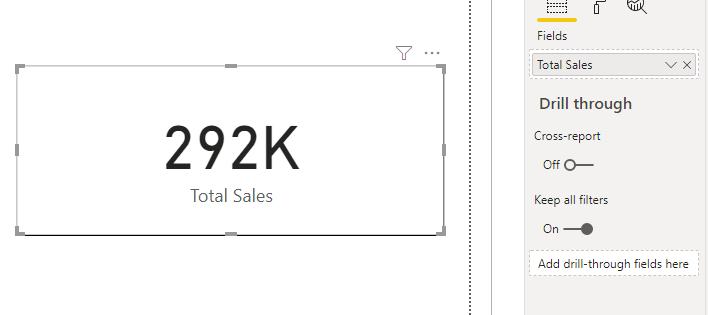
Power BI Blog: The COALESCE Function
9 July 2020
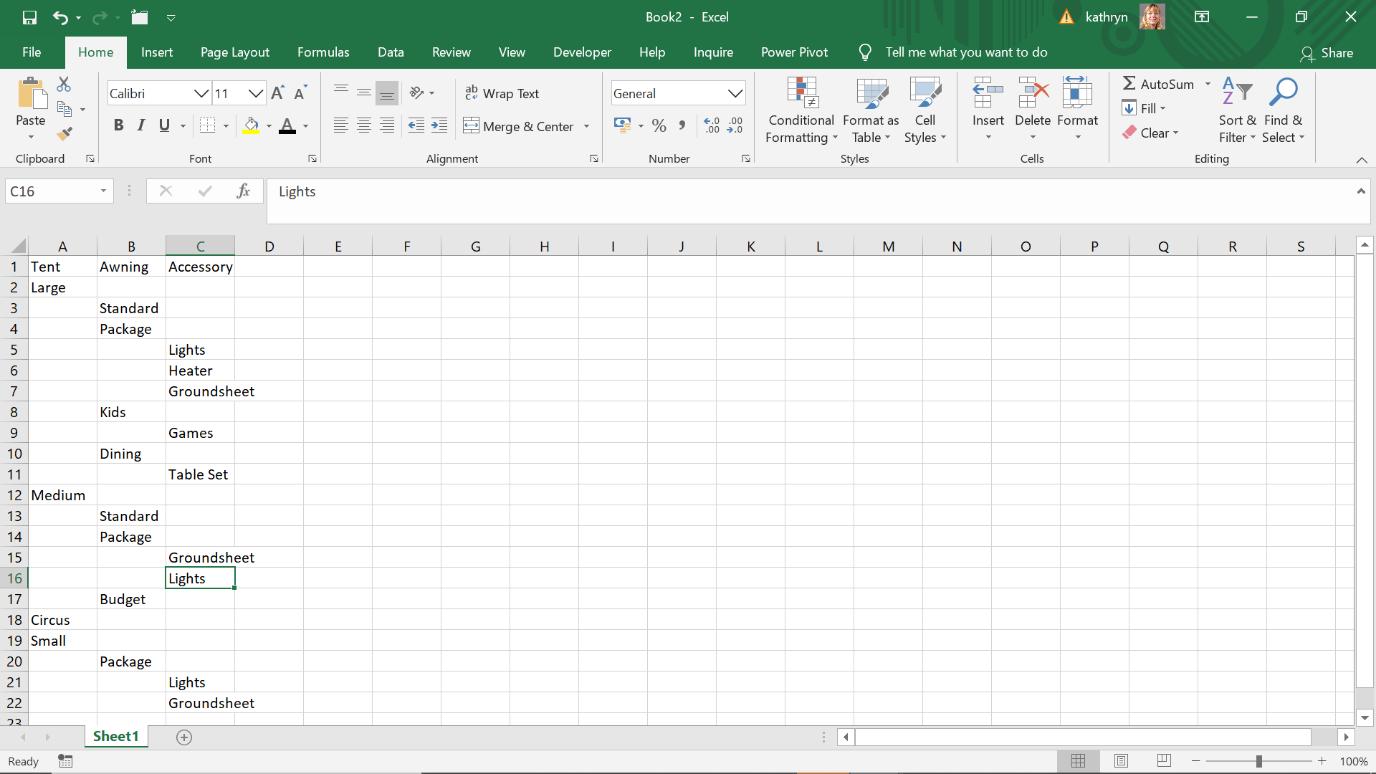
Power Query: Faster Fiddly Fill Down
8 July 2020