
Power Pivot Principles: Dynamic Ranges for Rolling Averages
13 August 2019
Welcome back to our Power Pivot blog. Today, we expand on the rolling average concept first introduced in a previous blog and show you how to include a dynamic selection range to a rolling average measure.
We have created a rolling average measure in a previous blog titled Introducing the DATESINPERIOD Function. As a recap, we used the following measure to calculate the three-day rolling average:
=CALCULATE(
AVERAGE(SaleDataJul1[Total Sales]),
DATESINPERIOD(
SaleDataJul1[Date],
MIN(SaleDataJul1[Date]),
-3,
DAY
)
)

This week, we are going to build in the ability to select the number of days we wish to include in the rolling average.
The first step we must take is to create a disconnected table. You can read more about disconnected tables here.
In this example we are going to use this disconnected table, namely the Days to Average table:

It has a range of one to 10 days. We then add this table to the data model:
We do not create a relationship between this table and our sales data table (called SaleDataJul1); we want these two tables to remain disconnected. Otherwise, this trick won’t work.
The next step is to modify our previous measure:
=CALCULATE(
AVERAGEX(SaleDataJul1, SaleDataJul1[Sum of Total Sales]),
DATESINPERIOD(
SaleDataJul1[Date],
MIN(
SaleDataJul1[Date]),
-MAX(
Days_Average[Days to Average]),
DAY
)
)

Instead of defining the days in the DATESINPERIOD function as ‘3’ we use the MAX function to determine the maximum number in the Days_Average table. Before we add this measure to our PivotTable, we need to create a slicer, so that our users may select the number of days to be included in our rolling average.
After creating the slicer and including our measure in our PivotTable, we have something similar to the following:
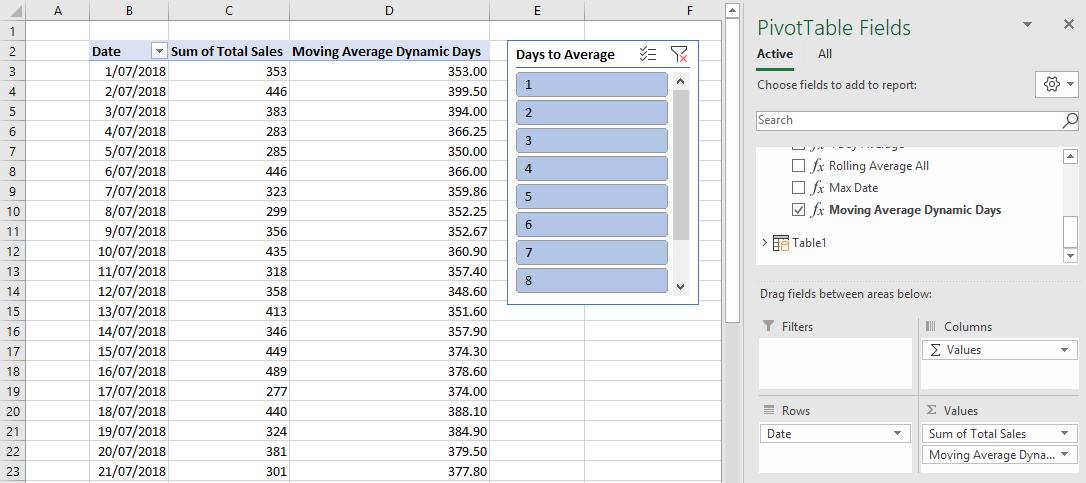
The moving average range seems to be set at 10 days. That is because we have not selected a number in the slicer. Therefore, the measure is picking up the maximum value in the Days_Average table, which is 10.
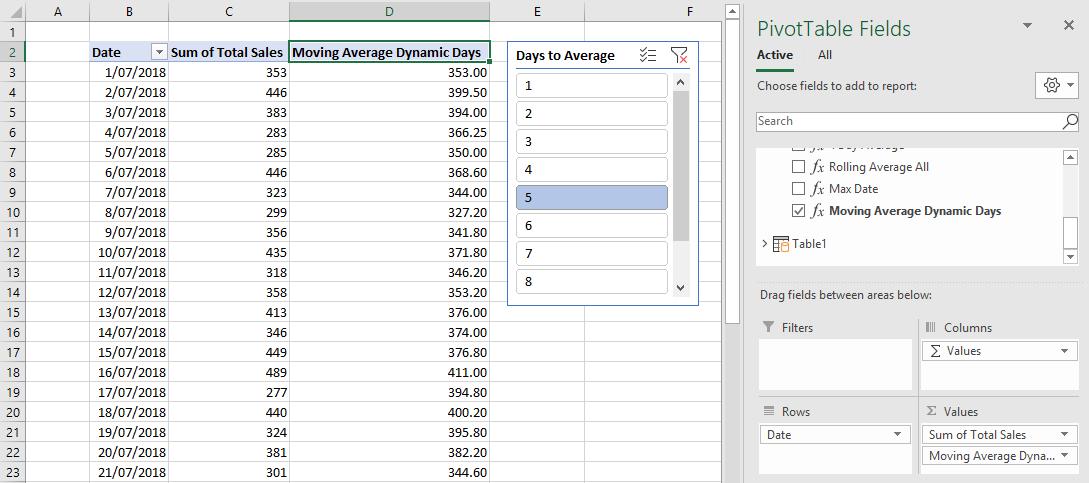
After selecting five (5) days, we the following result:
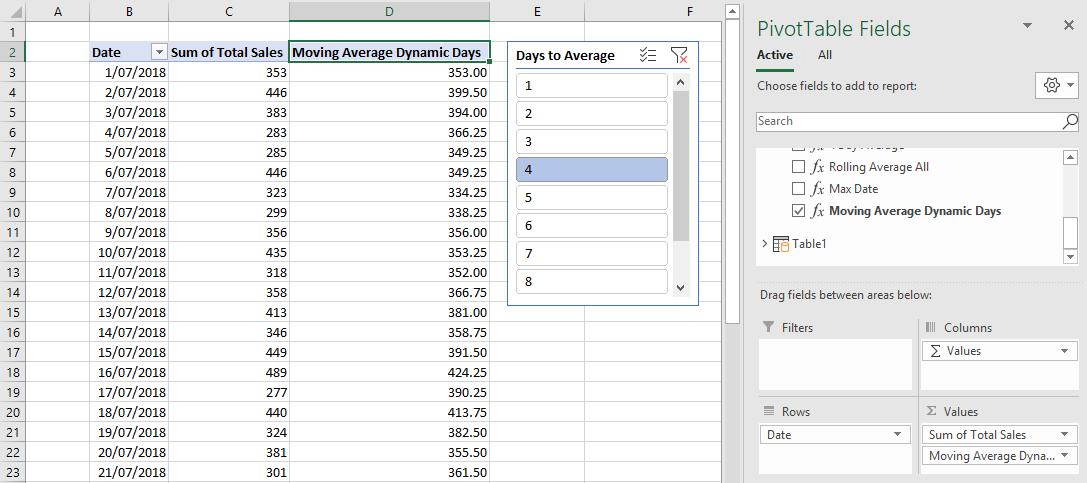
We can switch between any number in our Days to Average slicer. The Moving Average Dynamic Days measure will update accordingly:
That’s it for this week, come back next week for more Power Pivot. Until then happy pivoting!
Stay tuned for our next post on Power Pivot in the Blog section. In the meantime, please remember we have training in Power Pivot which you can find out more about >here. If you wish to catch up on past articles in the meantime, you can find all of our past Power Pivot blogs here.