
Power Pivot Principles: The A to Z of DAX Functions – ADDCOLUMNS
20 July 2020
In our long-established Power Pivot Principles articles, we are starting a new series on the A to Z of Data Analysis eXpression (DAX) functions. This week we’re building on what we have so far…
The ADDCOLUMNS function
The ADDCOLUMNS function adds calculated columns to a given table or table expression. It uses the following syntax to operate:
ADDCOLUMNS(table, name, expression[, name, expression]…)
- table is any DAX expression that returns a table of data
- name is a name given to the column, enclosed in double quotes
- expression is any DAX expression that returns a scalar expression, evaluated for each row of the table.
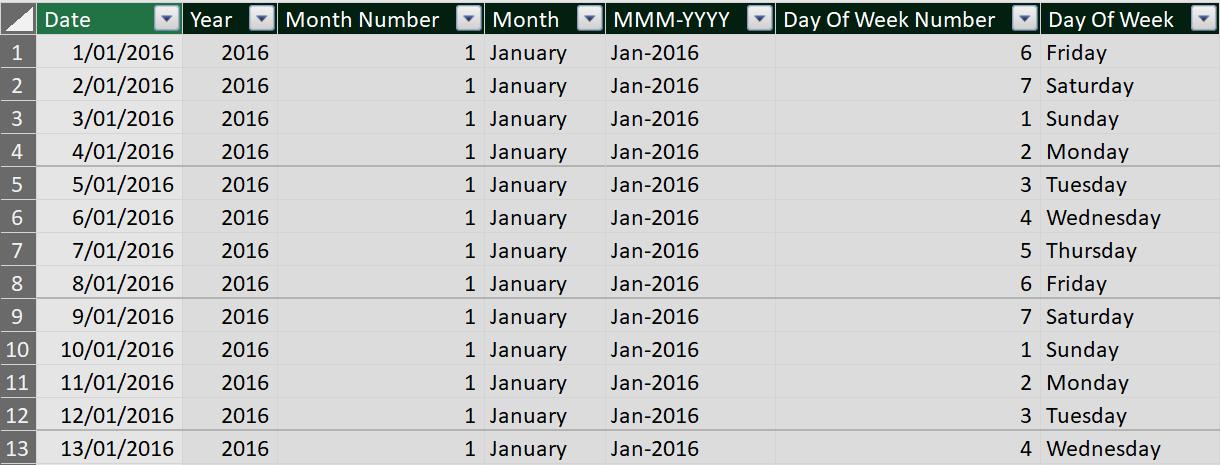
As an example, consider the following data table (not displayed in full):

This data table contains the sales amount for a specific date. We also create another calendar table in PowerPivot by using the method introduced here:
The two tables may be linked:

We can create a measure using the ADDCOLUMNS function:

ADDCOLUMNS here incorporates SUMMARIZE. Here, the calculation takes each combination of Year and Month as a coordinated filter context and uses the table returned from SUMMARIZE as the base for Monthly Sales calculation:

Come back next week for our next post on Power Pivot in the Blog section. In the meantime, please remember we have training in Power Pivot which you can find out more about here. If you wish to catch up on past articles in the meantime, you can find all of our Past Power Pivot blogs here.