
Power Pivot Principles: Power Pivot Principles : Creating a Calendar Table
29 October 2019
Welcome back to the Power Pivot Principles blog. This week, we are going to provide a refresher regarding creating a calendar table.
When analysing data, time series analysis is important for the comparison of historical financial or operational data. A calendar (date) table would allow us to perform the analysis in an easy way. It is essential to have such as table in relationship database schema. This is because no other data table may have a complete set of dates without omission or duplication.
Before creating a calendar table, there are several important points to note:
- The earliest date in the calendar table must be before or equal to the earliest date in any other table (fact(ual) or dimension / lookup) in the associated database
- The final date in the calendar table must be after or equal to the latest date in any other table (fact(ual) or dimension / lookup) in the associated database
- Dates must be in ascending order, increasing in increments of one day, with no duplication
- There must be no gaps (omissions) in the dates (e.g. Public Holidays and / or weekends must all be included).
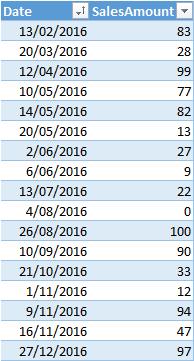
In our example, we have the SalesData table as shown below (data is not fully displayed). The earliest date and latest date are 13 February 2016 and 31 December 2018 respectively. Therefore, in our calendar table, the start date should be before or equal to 13 February 2016, and the final date should be after or equal to 31 December 2018.
To begin, we import the SalesData table into Power Pivot and then refer to the Design Ribbon -> Date Table -> New.
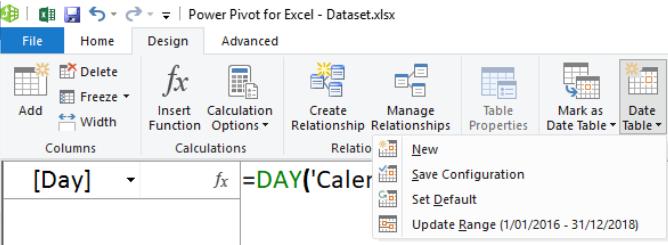
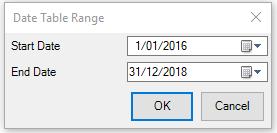
We then click Update Range, set the Start Date to 1 January 2016 and the End Date to 31 December 2018.
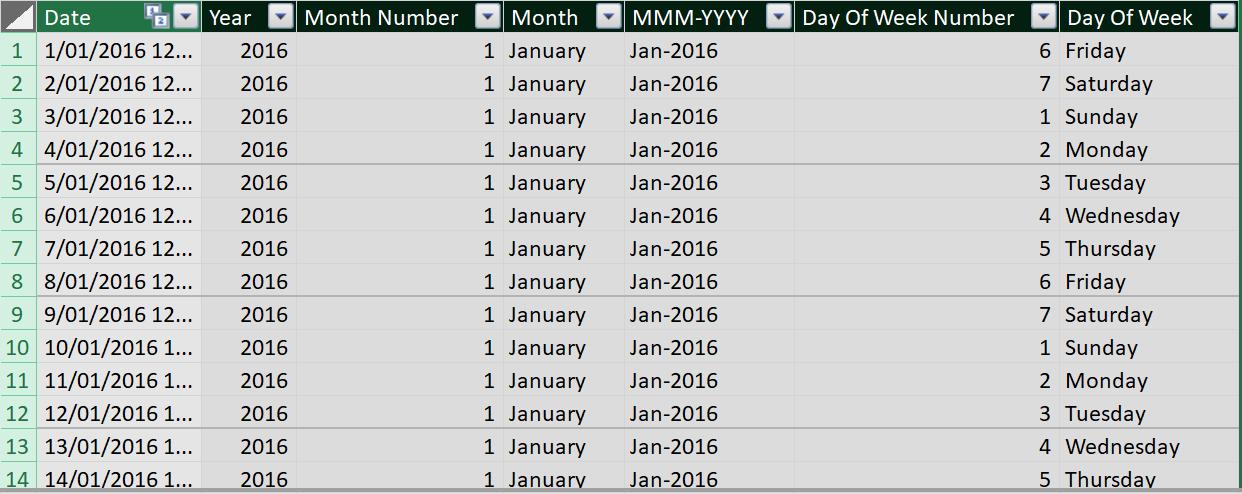
The calendar table would be automatically generated as shown below:
Then we create four other columns with the following headings:
- Day
- Financial Year (assuming a 30 June year-end)
- Calendar Year Quarter, called ‘Qtr (CY)’
- Financial Year Quarter, called ‘Qtr (FY)’ (assuming a 30 June year-end)
and enter the following formulae for each column:
- Day: =DAY(‘Calendar’[Date])
- FY: =YEAR(‘Calendar’[Date])+IF(MONTH(‘Calendar’[Date])>=7,1,0)
- Qtr (CY): =ROUNDUP(‘Calendar’ [Month]/3,0)
- Qtr (FY): =MOD(‘Calendar’ [Qtr (CY)]-3,4)+1
The result would be:
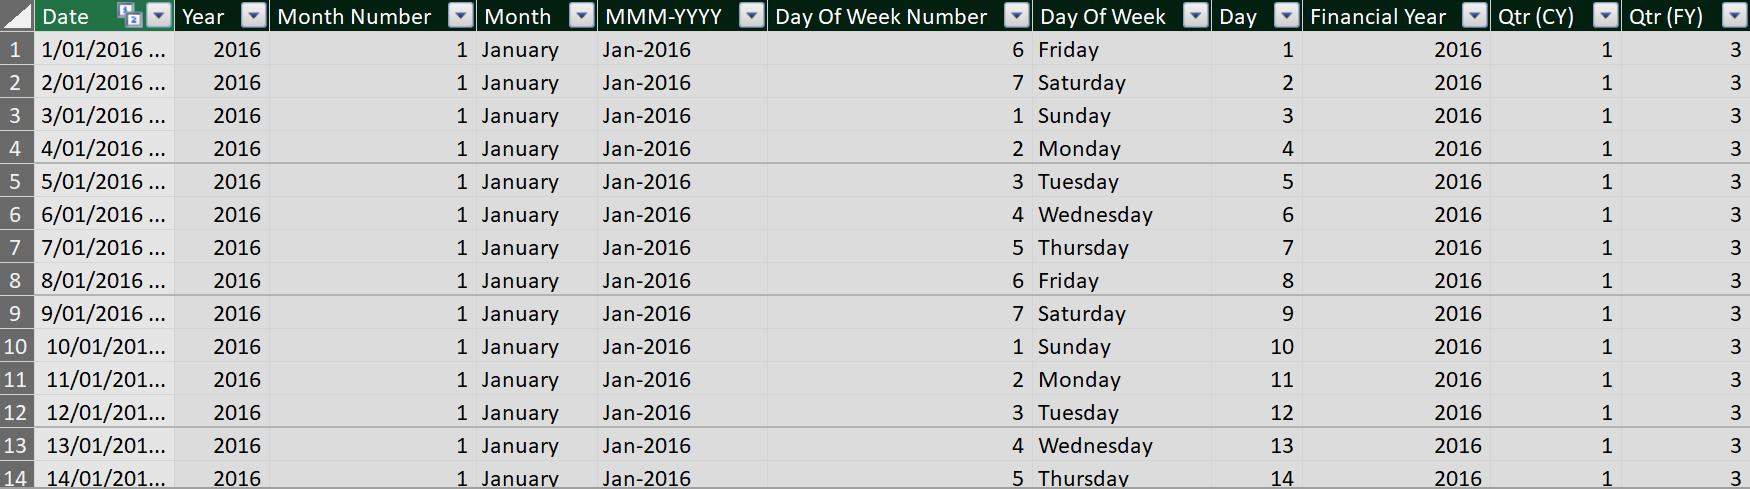
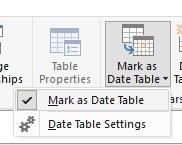
Power Pivot requires calendar tables to be designated as such, so that time series functions will work accordingly. This is known as “marking” the table as a date table. The calendar table highlighted has been marked as a date table automatically. You can check it in the Design Ribbon -> Mark as Date Table as shown below.
Now we have a calendar table ready for use. Essentially, this means when we use any time function in DAX, wherever it prompts for a date, we just use the field Calendar[Date] and ensure that all headers in any accompanying Table / PivotTable use dates from this Calendar table.
Stay tuned for our next post on Power Pivot in the Blog section. In the meantime, please remember we have training in Power Pivot which you can find out more about here. If you wish to catch up on past articles in the meantime, you can find all of our Past Power Pivot blogs here.