
Power BI Blog: Visual Calculations Are Looking Up
10 July 2025
Welcome back to this week’s edition of the Power BI blog series. This week we consider two new functions joining the visual calculations family.
Just recently, two new functions are joining the visual calculations family: LOOKUP and LOOKUPWITHTOTALS. Visual calculations simplify DAX by focusing on one visual at a time, allowing for easy creation of powerful calculations and verification of your work.
The new LOOKUP and LOOKUPWITHTOTALS functions enable retrieval of values from the visual matrix through absolute navigation with one or more filters applied. Although both functions serve similar purposes, they differ in handling omitted filters.
Consider a visual that shows the Sales per product Category and Class. In this visual, let’s add the following visual calculations:
LOOKUPExample = LOOKUP( AVERAGE( [Sales Amount] ), [Class], “H” )
LOOKUPWITHTOTALSExample = LOOKUPWITHTOTALS( AVERAGE( [Sales Amount] ), [Class], ”H” )
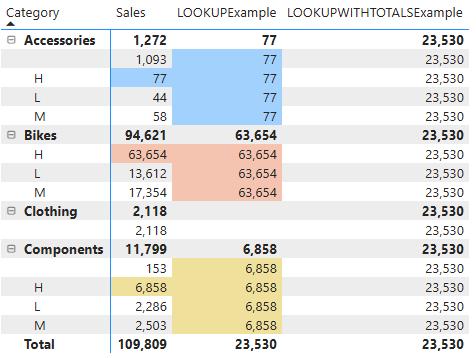
As demonstrated by the background colours in the image above, the LOOKUPExample visual calculation returns the average Sales for the products in the “H” class within each Category, as LOOKUP infers any omitted filters from the context.
In contrast, LOOKUPWITHTOTALS treats any omitted filters as referring to the total. Since we didn’t specify a filter for Category, the LOOKUPWITHTOTALSExample visual calculation returns average Sales for the products in the “H” class across all categories. This is the same value returned by the LOOKUPExampleon the Total row.
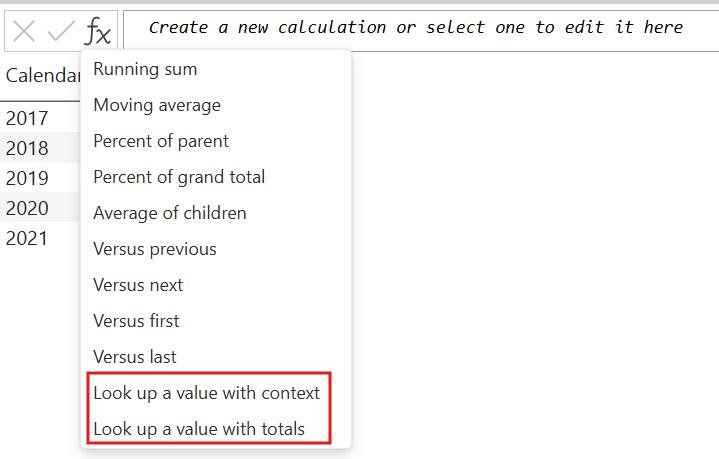
To make things even easier, Power BI has also added templates for both LOOKUP and LOOKUPWITHTOTALS:
In the meantime, please remember we offer training in Power BI which you can find out more about here. If you wish to catch up on past articles, you can find all of our past Power BI blogs here.