
Power BI Blog: Storytelling in PowerPoint
21 March 2024
Welcome back to this week’s edition of the Power BI blog series. This week, we look at the Power BI add-in for PowerPoint.
Just recently, Microsoft added new feature, a Power BI add-in for PowerPoint that makes it easier to find and insert the Power BI reports you need for your presentation.
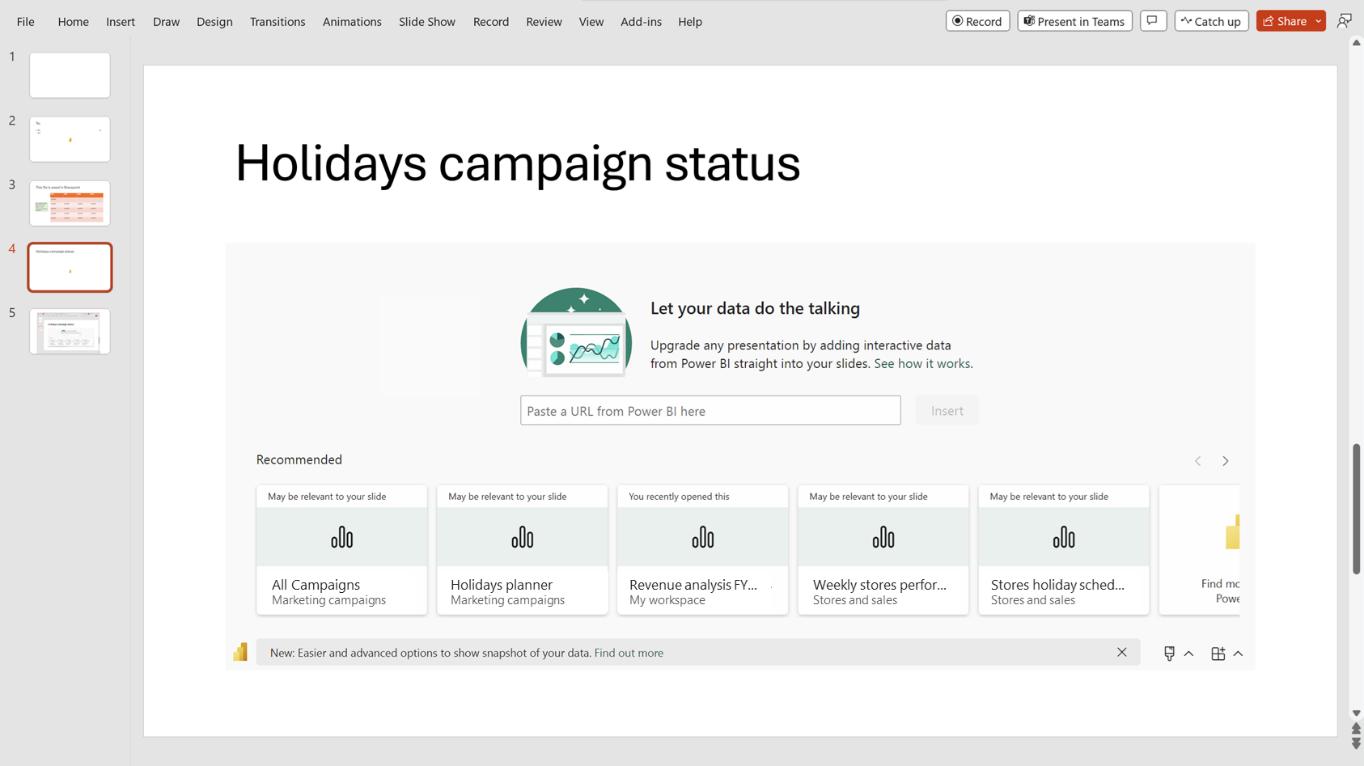
When you add the Power BI add-in to your slide, the add-in automatically scans the title of the slide and suggests Power BI content that might be relevant. For example, if the title of your slide is “Holiday campaign status”, the add-in will show you a list of Power BI reports that contain data about campaigns.
The add-in also shows you reports you’ve recently visited in Power BI, so you can easily access reports you’re working on or frequently use.
It should be noted that if the report you wanted to add doesn’t appear in the list of suggestions, you can just copy the report’s URL and paste it into the input box, as you’ve always done.
Once you find the report you want to insert, you can choose to insert a complete page or a specific visual from the report. You can also update filters or slicers before you insert your selection. Filter and slicer values are saved together with the report or visual you picked.
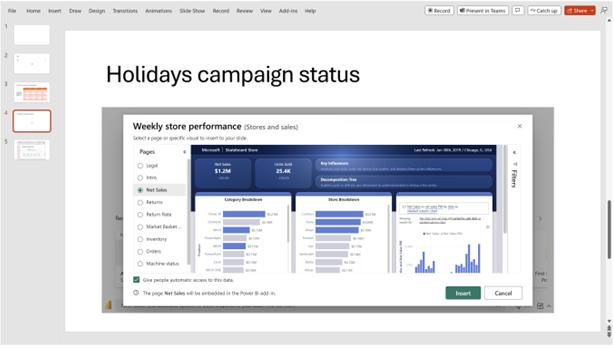
If you have permission to grant others access to this report, you can also select the ‘Give people automatic access to this data’ checkbox, so that when others in your organisation view this presentation, they’ll be able to see the data you’ve just added to the slide.
In the meantime, please remember we offer training in Power BI which you can find out more about here. If you wish to catch up on past articles, you can find all of our past Power BI blogs here.