
Power BI Blog: Sparklines
21 August 2025
Welcome back to this week’s edition of the Power BI blog series. This week, although taken for granted in Excel, it’s only recently Sparklines have become readily available in Power BI.
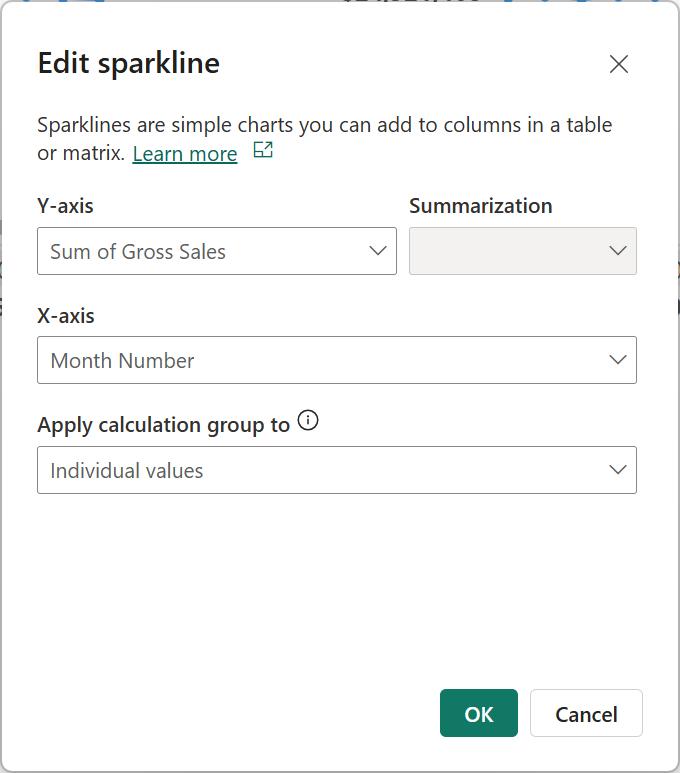
Similar to those in Excel, Sparklines are tiny charts shown within cells of a table or matrix that make it easy to see and compare trends quickly. They have been in Preview since December 2021 and are finally Generally Available. Furthermore, Power BI has added new functionality for those who work with both Sparklines and calculation groups together as you can now decide how a calculation group is applied to the Sparkline. You can choose between ‘Individual values’ (default) or ‘Entire sparkline’.
For new Sparklines, calculation group selections will be applied to the individual values on the Sparkline by default. If you change the setting to ‘Entire sparkline’, the calculation group will be evaluated over all the points on the Sparkline. Existing Sparklines will remain unchanged and calculation group selections will continue to apply to the entire Sparkline unless you change their configuration.
An example of this in practice is a measure that calculates the Sum of Gross Sales by totalling the Gross Sales.
Sum of Gross Sales = SUM( financials[Gross Sales] )
A measure called IsBigSales has been added, which compares the Sum of Gross Sales against a BigSalesSize cutoff value set to 1,000,000 using a field parameter:
IsBigSales = IF ( 'financials'[Sum of Gross Sales] >= BigSalesSize[BigSalesSize Value], TRUE, FALSE )
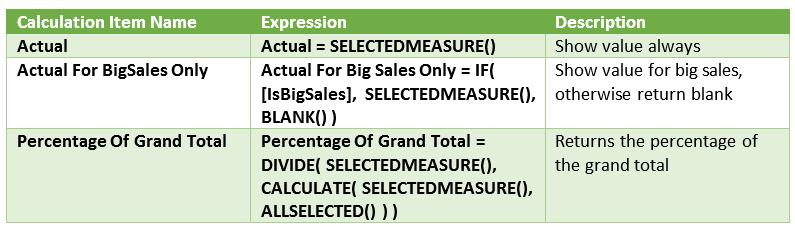
A calculation group was added that contains three [3] calculation items:
A matrix was created to display the sum of gross sales by product. Additionally, a Sparkline was added to illustrate the sum of gross sales by month:
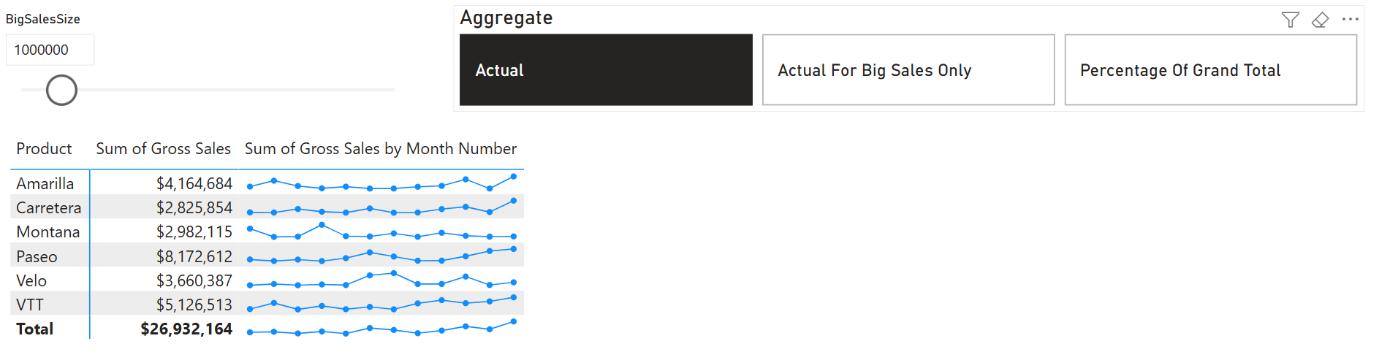
The Sparkline that shows Sum of Gross Sales by Month Number is set to the default behaviour of applying the Sparkline to ‘Individual Values’:
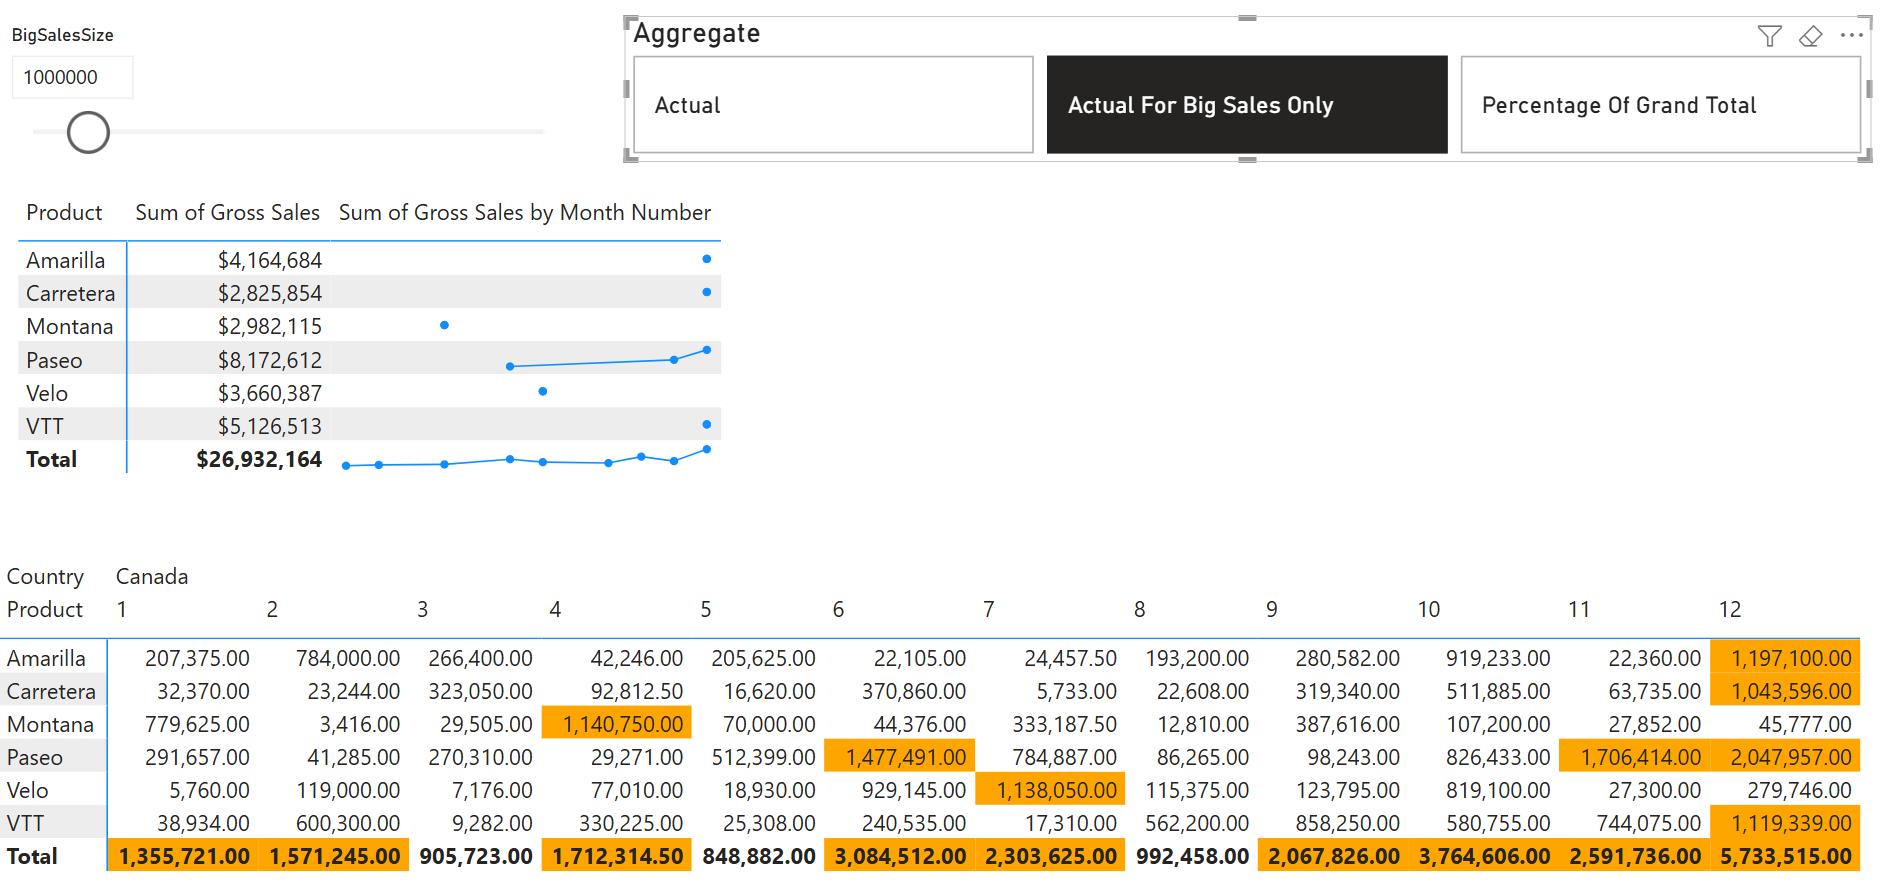
When switching the calculation group to ‘Actual for Big Sales Only’ using the slicer, it will evaluate each value on the Sparkline. Therefore, it will display only values for months and brand combinations exceeding the 1,000,000 BigSalesSize cutoff. To enhance clarity, a matrix that displays Gross Sales by Month and Product has been included, utilising conditional formatting to emphasise values above the cutoff. The highlighted values correspond with those on the Sparkline:
Let’s set the Sparkline to apply the calculation group to the entire Sparkline. Now, all Sparklines appear because the calculation evaluates the total values without considering the x-axis (Month Number). Since each Product’s Gross Sales exceed the cutoff point, all Sparklines display. If we raise the cutoff to 3,000,000, some Sparklines will disappear. A matrix with conditional formatting has been displayed below to illustrate this behaviour:
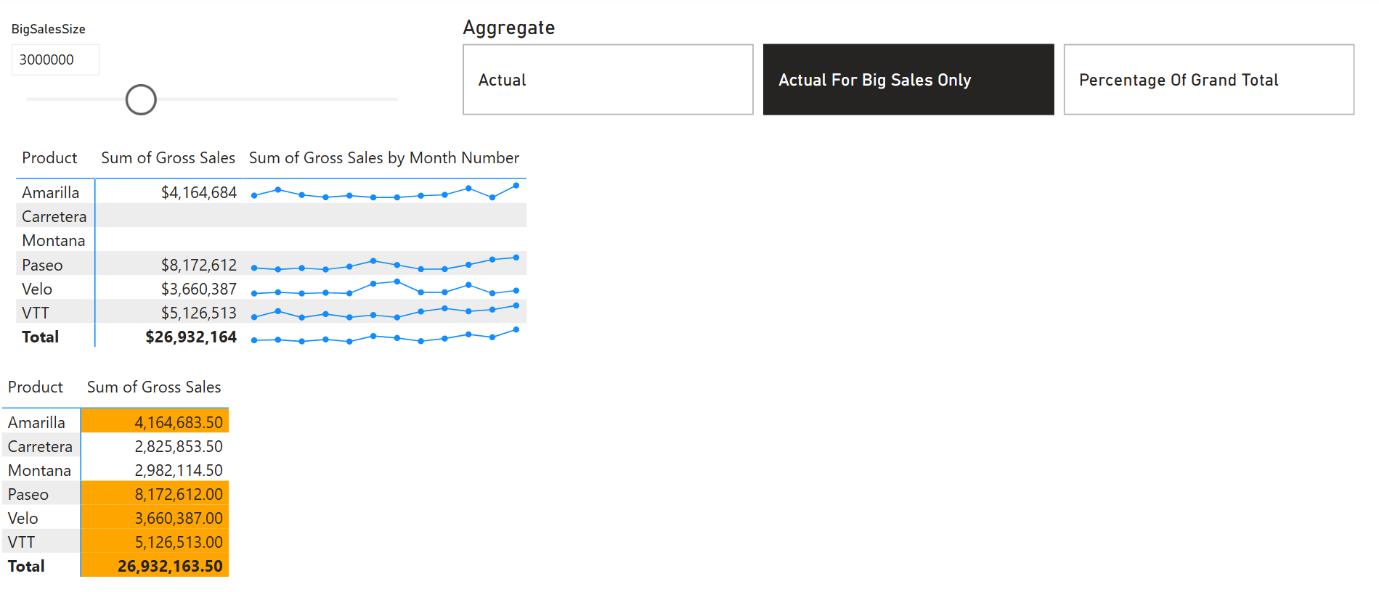
The Sum of Gross Sales exceeds the cutoff for almost all Products, except Carretera and Montana. Consequently, it’s not displayed in the matrix or as a Sparkline for these products. Sparklines appear normally for other Product / Country combinations. ‘Show items with no data’ is enabled to display brands where the Sparkline and Sum of Gross Sales return BLANK(); otherwise, those brands would be hidden.
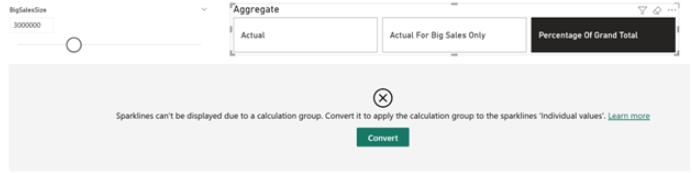
It is important to recognise that applying a calculation group item, which performs an arithmetic operation, to a Sparkline set to ‘Apply to entire sparkline’ is not supported. To illustrate this, let’s change the calculation group to Percent of Grand Total (which indeed performs an arithmetic operation using DIVIDE). As a result, the visual showing the Sparkline will show an error and prompt you to set the Sparkline to ‘Individual values’ to display it correctly again:
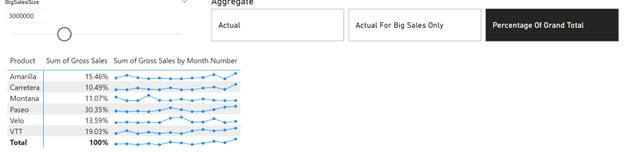
Pressing Convert or setting the Sparkline to ‘Individual values’ again will make the visual show again:
In the meantime, please remember we offer training in Power BI which you can find out more about here. If you wish to catch up on past articles, you can find all of our past Power BI blogs here.