
Power BI Blog: Referenced Column Highlights
15 May 2025
Welcome back to this week’s edition of the Power BI blog series. This week, we look at referenced column highlights for visual calculations.
If you are struggling with DAX calculations, visual calculation is here to help to make adding calculations easier and faster. Visual calculations now include referenced column highlights to indicate the columns referred to in your visual calculation. These highlights, akin to those in Excel, will show up in the visual matrix as soon as a column is referenced, and the reference in the visual calculation formula will be marked with the corresponding colour.
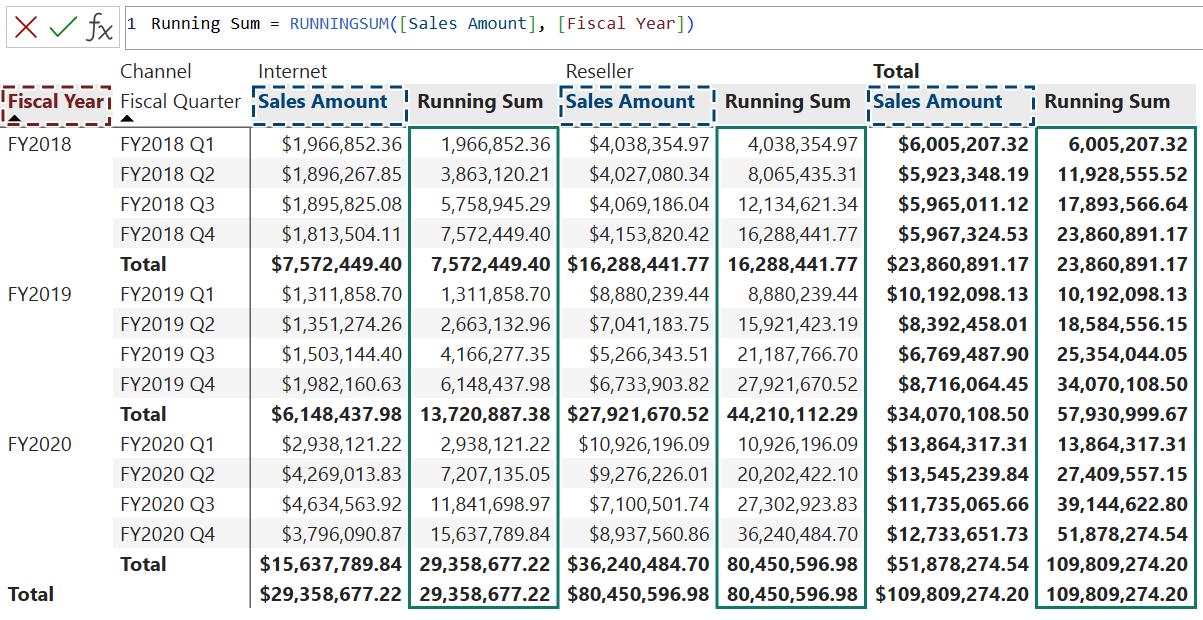
For example, let’s create a visual calculation that calculates the running sum of Sales Amountand resets for every year:
Running Sum = RUNNINGSUM([Sales Amount], [Fiscal Year])
When editing this visual calculation, the related column headers are highlighted:
Additionally, the referenced column highlights can be turned off and on using the matrix highlights toggle that is on the right of the Formula bar in visual calculations edit mode:

It is located on the right of the Formula bar in visual calculations edit mode.
Apparently, this is only the beginning of making visual calculations even easier to use, so stay tuned for more!
In the meantime, please remember we offer training in Power BI which you can find out more about here. If you wish to catch up on past articles, you can find all of our past Power BI blogs here.