
Power BI Blog: Summarising the Top N Number of Cities in a Dataset
10 September 2020
Welcome back to this week’s edition of the Power BI blog series. This week, we look at how to parameterise the summarisation of the top number of Cities in a dataset.
A while ago we talked about the TOPN function, and we used it to summarise the top two countries in a dataset. This week, we want to look at summarising the top cities in the same dataset, where we can flex the number we wish to select.
The DAX code for the measure that will summarise the top two (2) cities in our dataset is:
Sales of Top 2 Cities =
CALCULATE([Total Sales],
TOPN(2,
Values(Geography[City]),
[Total Sales],
DESC
)
)
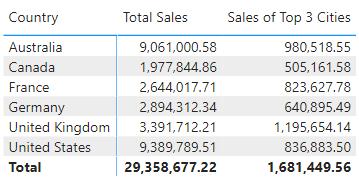
If we want to summarise more than just the top two cities we can change the ‘2’ in the measure to a greater number, say ‘3’.
Sales of Top 3 Cities =
CALCULATE([Total Sales],
TOPN(3,
Values(Geography[City]),
[Total Sales],
DESC
)
)
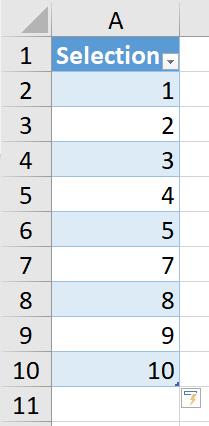
But what if your end user is fickle and wants to be able to change the number of cities to summarise on the fly? We can parameterise the selection by using a disconnected table, meaning this table should have no relationships with the other tables in our dataset. You can read more about disconnected tables here.
We can create the following table in Excel and load it into Power BI:
Now that we have the Selection table loaded into Power BI we can create a measure to pull out the number of cities that we want to summarise by.
Selection = IF(ISFILTERED(Selection[Selection]),MAX(Selection[Selection]),1)
If you have read the blog on disconnected tables, we used a simple MAX approach there. However, I prefer to use an ISFILTERED condition. This is so that I can delineate which value to use in the scenario where no selection has been made.
The next step is to create a slicer for the selection.
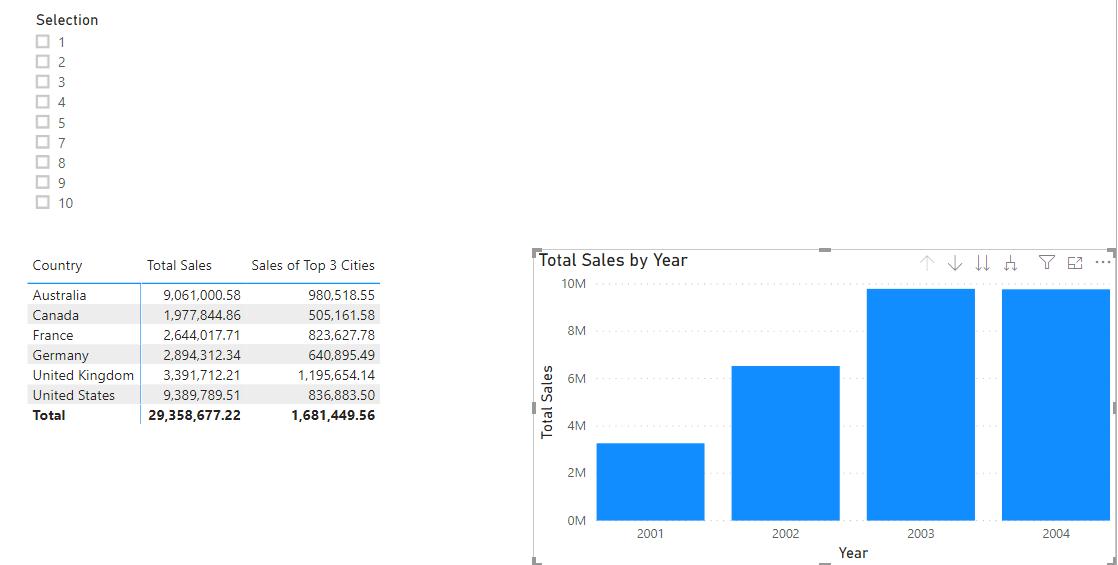
Now we can add the Selection measure to our Sales of Top 3 Cities measure to parameterise it.
Sales of Top Selected Cities =
CALCULATE([Total Sales],
TOPN([Selection],
Values(Geography[City]),
[Total Sales],
DESC
)
)
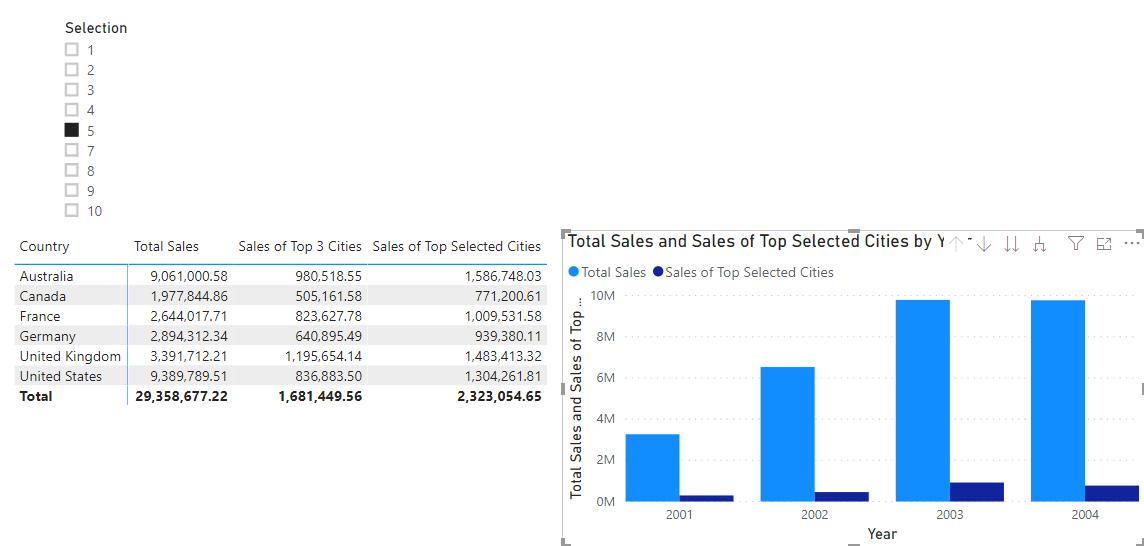
Our report should now look like this:

We can select a number and Power BI will update the calculations accordingly and return with the updated sales of the top N number of cities!
That’s it for this week, come back next week for more on Power BI.
In the meantime, please remember we offer training in Power BI which you can find out more about here. If you wish to catch up on past articles, you can find all of our past Power BI blogs here.