
Power BI Blog: Real-time Forms to Dashboard
22 August 2019
Welcome back to this week’s Power BI blog series. This week, we are going to create an example of a real-time dashboard.
Remember the Excel Summit South?
As you may know, in late July / early August, SumProduct was proud to host the Excel Summit South 2019 in four Australian cities: Brisbane, Sydney, Melbourne, and Perth. In case you missed it, no worries, we will come back next year, so please stay tuned!
After the conference, as an administrator, I was excited to get feedback from our attendees, and to generate this into insightful reports. The problem is, not all attendees responded to the feedback survey at once, but we do want our report to be most up-to-date it can be. Microsoft Forms and Power BI can help us.
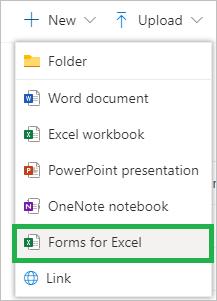
First of all, I log in to my OneDrive account online to create a new file. From ‘New’, I choose ‘Forms for Excel’:
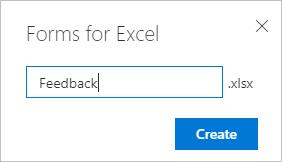
Then I create a name for my survey:
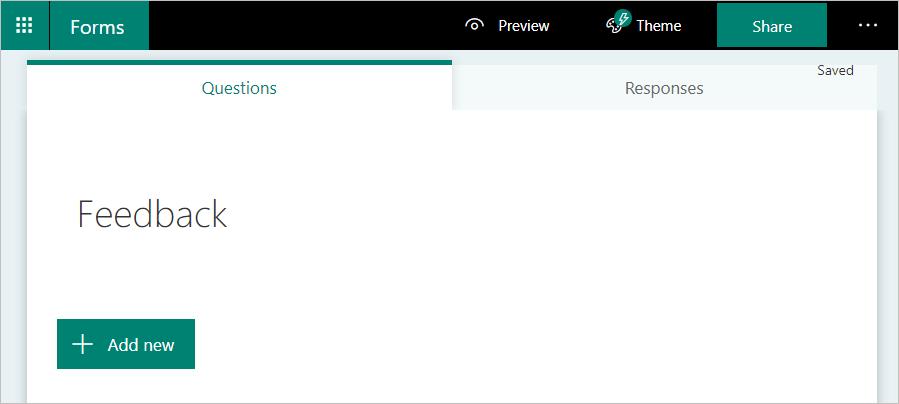
As soon as I hit ‘Create’, a new Microsoft Forms tab will be opened. Here, I can customise my survey:
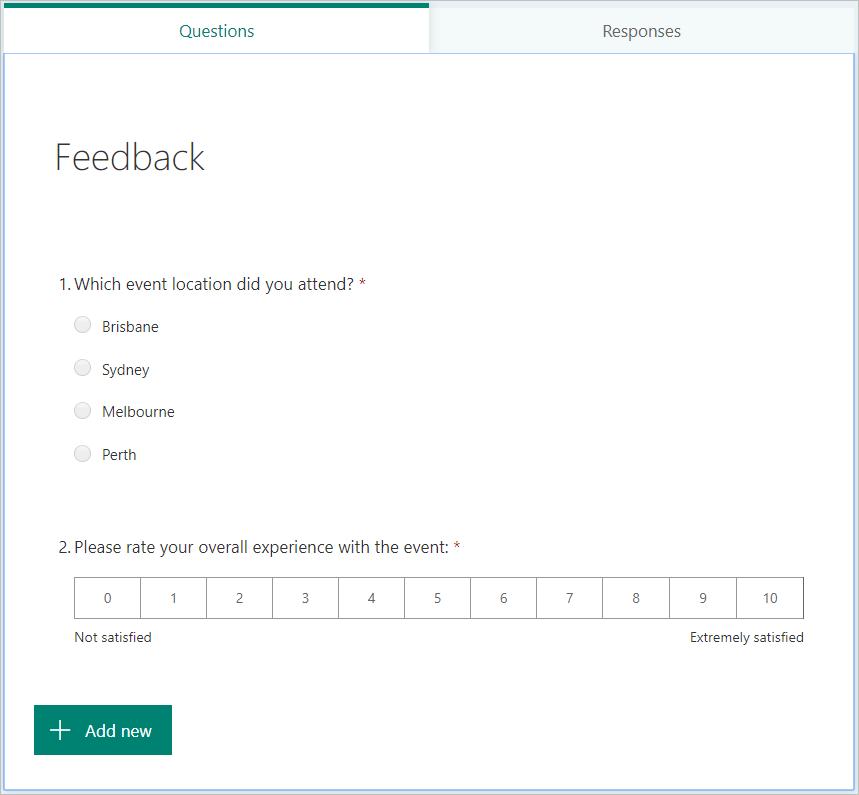
I create a sample survey like the one pictured below:
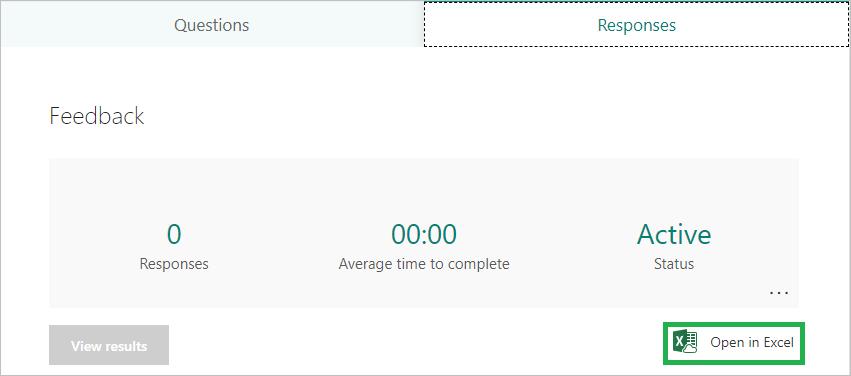
When I switch to the ‘Responses’ tab, I can see now I have no responses yet (since I have not published the survey), and also note that there is a cloud icon next to the ‘Open in Excel’ button, which means survey responses will be saved under the Excel file in OneDrive folder I’ve just added a moment ago:
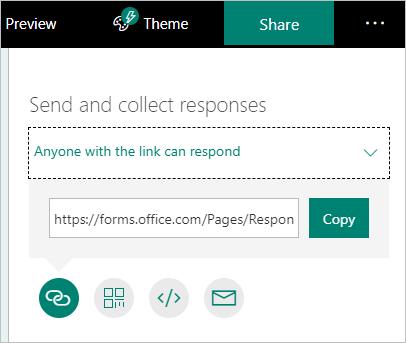
In the ‘Share’ tab, I set up my sharing preference. Microsoft Forms allows you to share the survey via link, QR codes, embedded website or email. Remember to turn on the option ‘Anyone with the link can respond’.
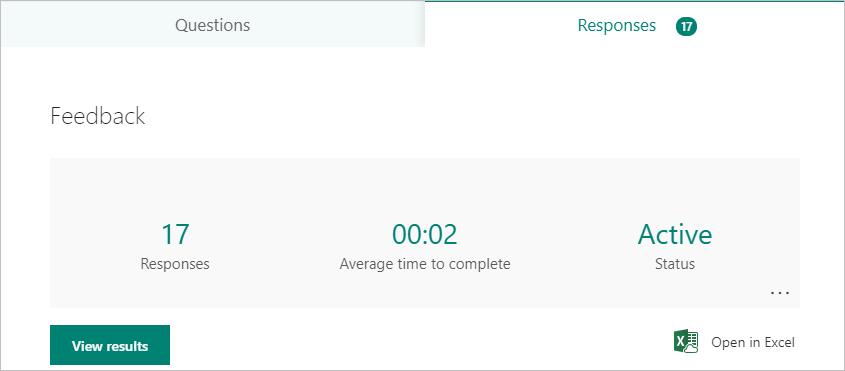
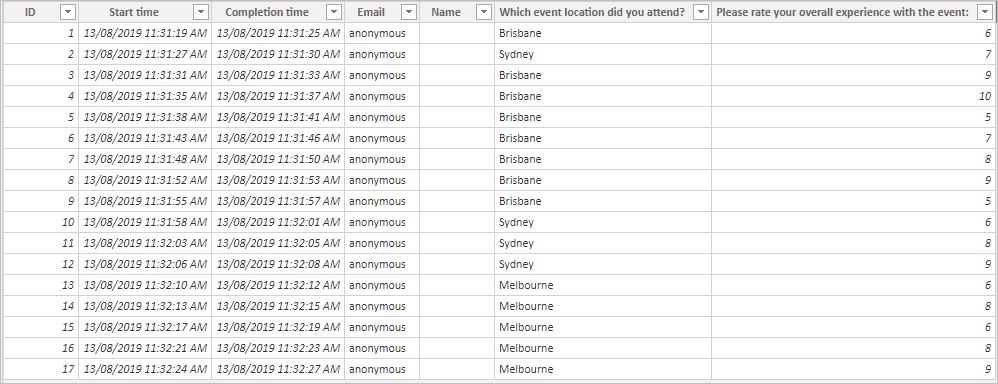
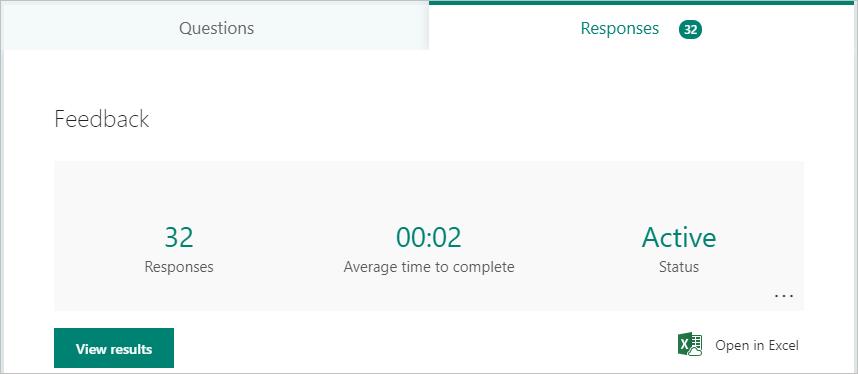
After a while, I find I have 17 responses on hand:
It’s good to start my report. I go to my local OneDrive folder and choose the Feedback.xlsx file there…
…to load it into Power BI:
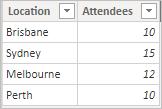
I also need to load the data of total attendees in each location:
I create the relationship between these two tables, based upon the location I will use later in the report:
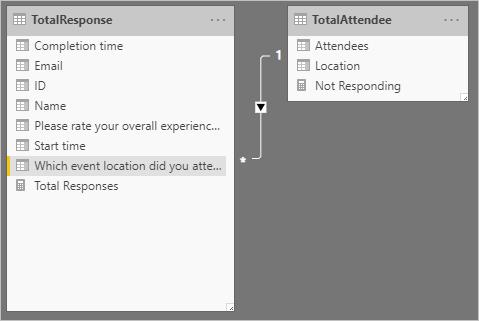
I add three new measures as follows to use in my visuals:
Total Responses = CALCULATE(COUNT(TotalResponse[Which event location did you attend?]))
Not Responding = CALCULATE(SUM(TotalAttendee[Attendees])-[Total Responses])
Total Score = Calculate(AVERAGE(TotalResponse[Please rate your overall experience with the event:]))
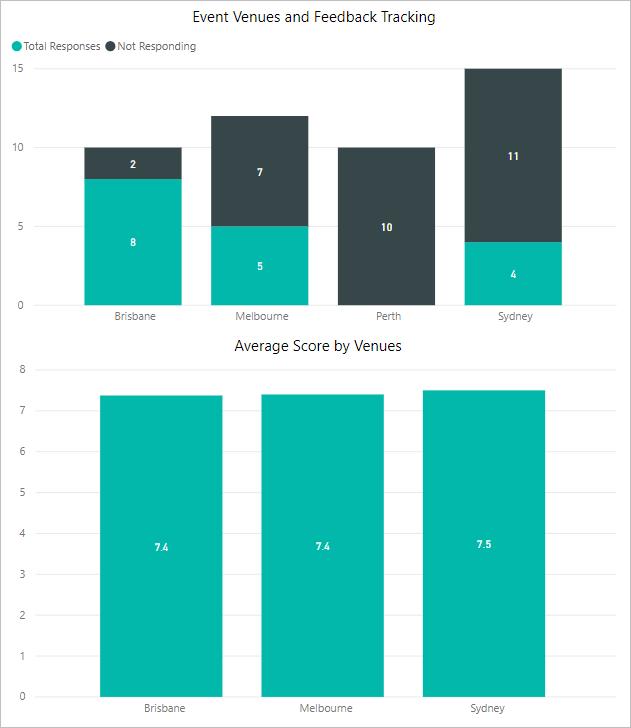
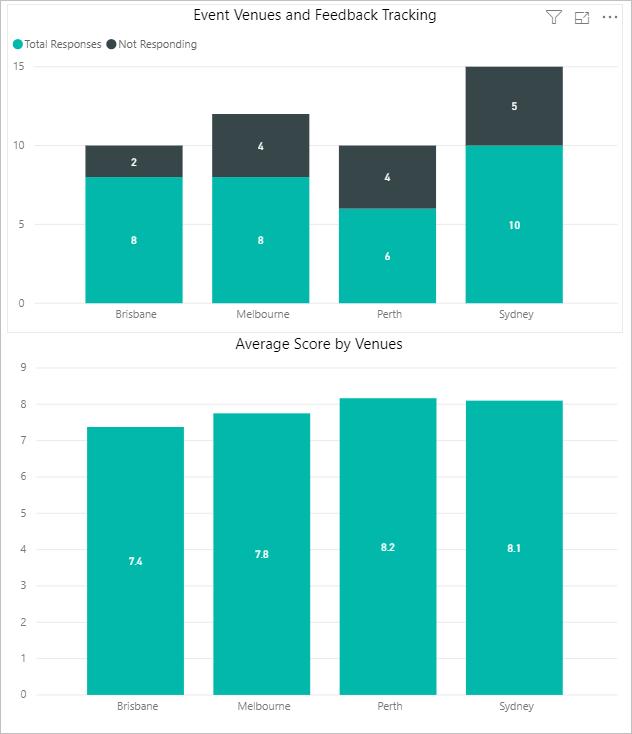
Currently I have two visuals, like the ones below. I am able to see how many responses I get compared to the total number of attendees in each of the venue, which gives me a better idea of the overall performance evaluation. Now, I still have not received any replies from Perth’s attendees, so there’s no score column for Perth.
Meanwhile, my survey receives further feedback:
It’s time for the long-awaited one-button updated dashboard! I go to ‘Home’ and hit ‘Refresh’:
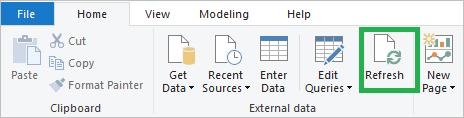
Yahoo! All of my visuals are updated accordingly:
That’s it for this week.Check back next week for more Power BI tips.
In the meantime, please remember we offer training in Power BI which you can find out more about >here. If you wish to catch up on past articles, you can find all of our past Power BI blogs here.