
Power BI Blog: Rampant Column Widths
13 August 2020
Welcome back to this week’s edition of the Power BI blog series. This week, we look at how to control table column widths in Power BI.
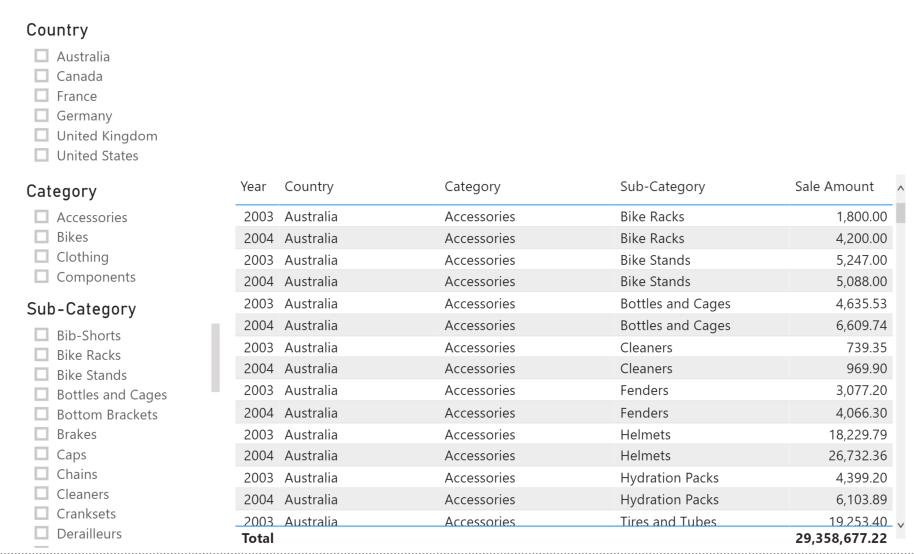
Imagine that we have created the following table in Power BI:
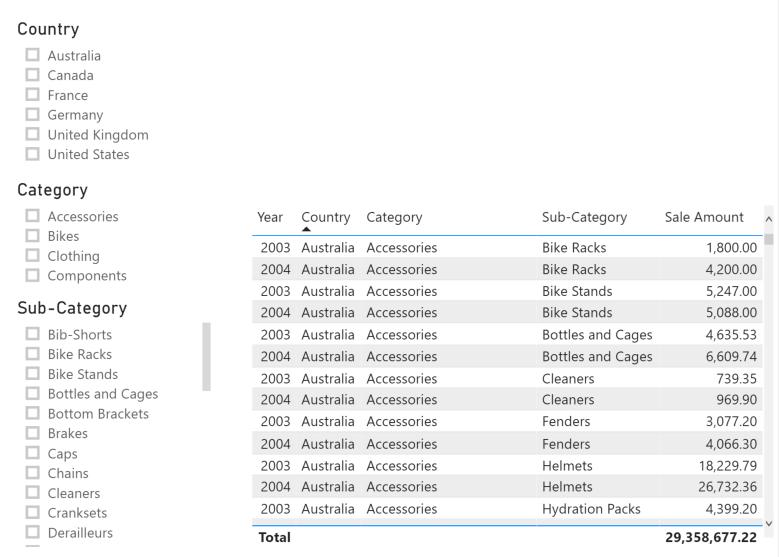
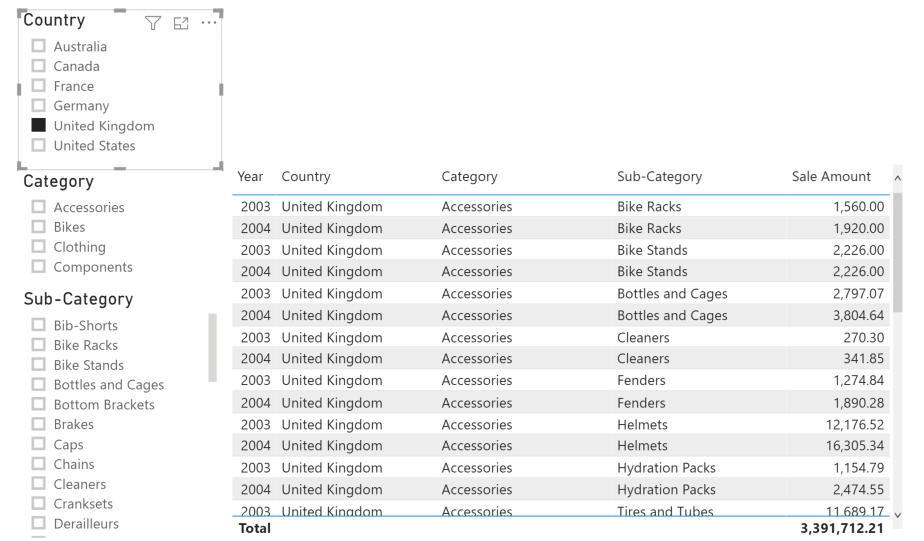
We have also just laid out the column widths so that the data is presented evenly across the table. However, when the user selects some of the slicer options, this happens:
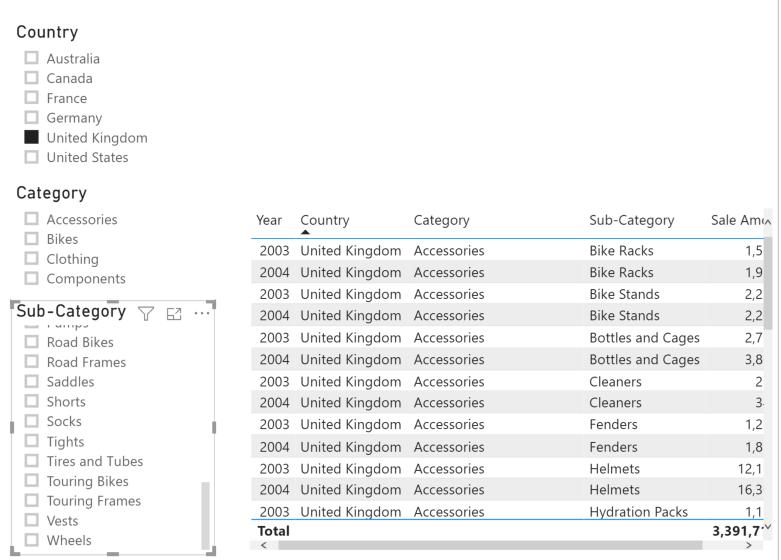
Great, Power BI has just undone all of our work and adjusted the table column widths automatically. This has made it impossible to see how many sales we have made in the UK.
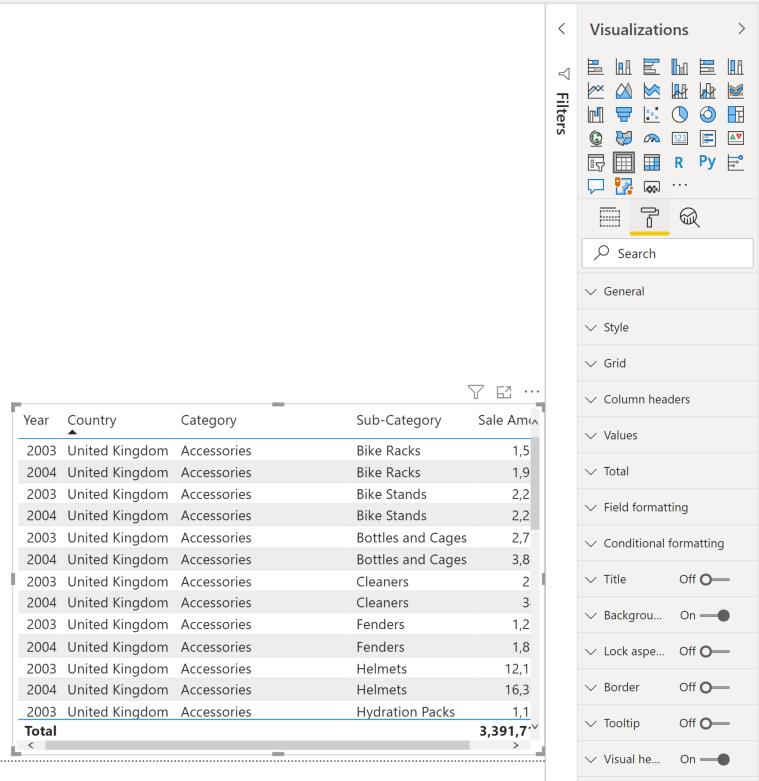
To fix this, click on the table visualisation, and navigate to the Format area under the Visualizations pane:
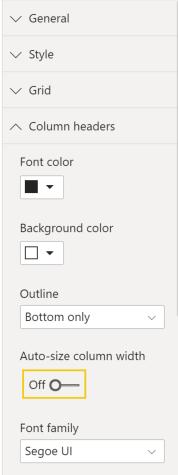
Expand the ‘Column Headers’ option and toggle the ‘Auto-size column width’ to Off:
Now let us resize our table again:
If we select ‘United Kingdom’ hopefully we do not have the ‘Sale Amount’ obscured by the edge of the table again:
Fantastic! Just a quick tip that may save you some time when formatting your dashboards.
In the meantime, please remember we offer training in Power BI which you can find out more about here. If you wish to catch up on past articles, you can find all of our past Power BI blogs here.