
Power BI Blog: Group Type – Bin (Grouping Numerical Values in Power BI)
12 November 2020
Welcome back to this week’s edition of the Power BI blog series. This week, we explore using the Data Groups functionality in Power BI… again!
Last week, we looked at grouping text values using the grouping functionality in Power BI. However, in that example I only touched on the text grouping functionality. Let’s cover the other aspect, and look at grouping or “binning” numerical values.
As a quick recap, we used the Groups functionality in Power BI to group categories together:

Moving on to this week’s example, we can also use this feature to group (bin) numerical values in a field. Let’s take a look at the SalesAmount column:

We can right click on the SalesAmount column and click on the ‘New Group’ option.

The ‘Bins’ option will be selected by default in the Groups dialog box. This is because we have chosen to group a numerical field, viz.

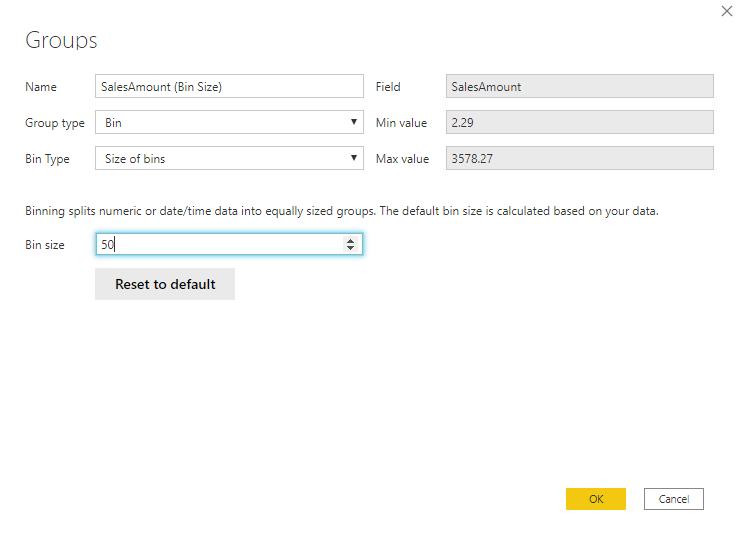
Here, we can also select the ‘Bin Type’. This drop-down option allows us to choose between ‘Size of bins’ and ‘Number of bins’:

If we select the ‘Size of bins’ option, we will then have to define the ‘Bin size’.
We are going to call this column ‘SalesAmount (Bin Size)’ and we are going to set the ‘Bin size’ to 50.
For the other option, ‘Number of bins’, we will be prompted to enter the number of bins we want to create. Power BI will also display the ‘Bin size’ to the right: this number will change depending upon the number of bins we select. We are going to call this column ‘SalesAmount (num of bins)’ and set the ‘Bin count’ to 10. With a ‘Bin count’ of 10, the respective bin size has been allotted to 357.598. This translates to 10 bins each, 357.598 dollars apart.

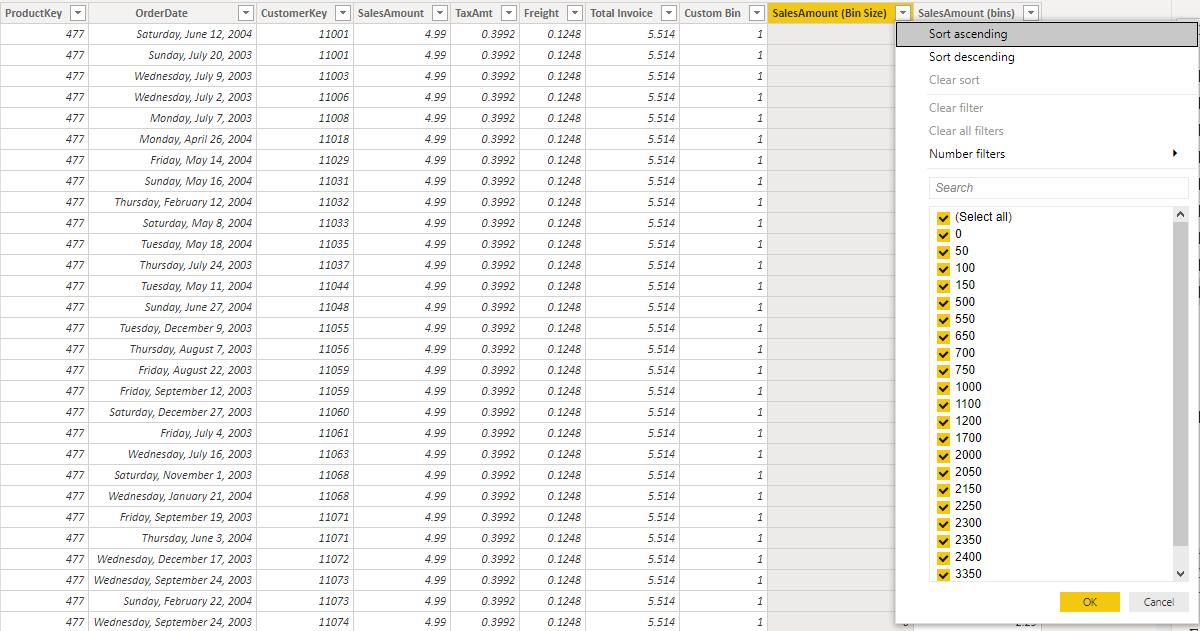
Let’s take a look at the two columns we have created. The ‘Bin size’ option has created bins that bin the data in increments of 50. The way to read the bins is all SalesAmounts between $0 and $49.99 will be grouped into the zero (0) bin.
For the ‘Number of bins’ option, the groups function has created a column that groups the data in 10 equally sized bins, between the minimum value ($2.29) and largest value ($3220.67), in the dataset.
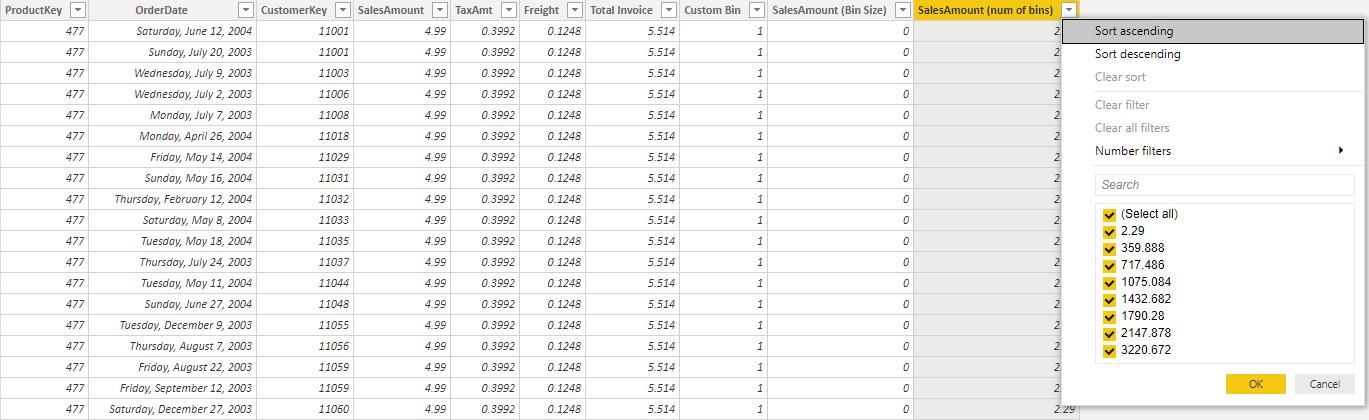
The 2.29 bin will hold all of the sales amounts that range from $2.29 to $359.87, which is one cent less than the 359.88 bin.
That’s it for this week, a simple overview on how to use the ‘New Group’ bin function in Power BI.
In the meantime, please remember we offer training in Power BI which you can find out more about here. If you wish to catch up on past articles, you can find all of our past Power BI blogs here.