
Power BI Blog: Creating Tables in Power BI
23 January 2020
Welcome back to this week’s Power BI blog series. This week, we are going to talk about creating tables in Power BI.
Before we can jump straight into how to create tables in Power BI, we have to first introduce the UNION and ROW functions.
The UNION function uses the following syntax to operate:
UNION( <table_expression1>, <table_expression2> [, <table_expression>]…)
where:
- <table_expression> is any DAX expression that returns with a table.
Similarly, the ROW function returns with a table with a single row. It uses the following syntax to operate:
ROW( <name>, <expression>[[, <name>, <expression> ]…])
where:
- <name> is the name given to the column and has to be enclosed in double quotation marks
- <expression> is any DAX expression that returns with a single scalar value to populate the column.
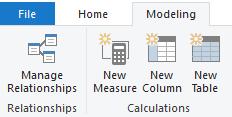
Arguments in the ROW function should come in pairs: each <name> must be accompanied with an <expression>. For example, let’s create a simple table in Power BI. To do this, we navigate to the Modeling tab on the Ribbon and click on ‘New Table’:
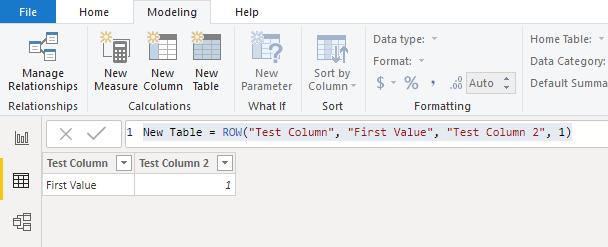
We can then use the following code to create a simple table:
New Table = ROW("Test Column", "First Value", "Test Column 2", 1)
Power BI will create the following table:
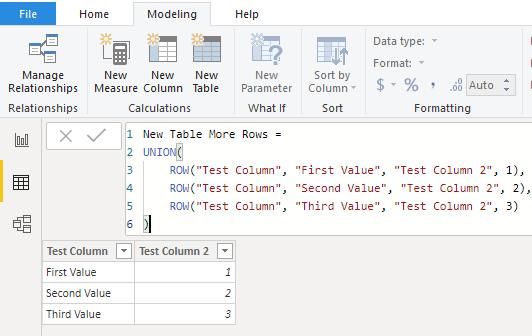
We can use both functions together to create a table with more than just 1 row:
New Table More Rows =
UNION(
ROW("Test Column", "First Value", "Test Column 2", 1),
ROW("Test Column", "Second Value", "Test Column 2", 2),
ROW("Test Column", "Third Value", "Test Column 2", 3)
)
Power BI will now create a table like this:
That’s great as far as it goes, but we may also use the “Enter Data” option on the Home tab to create a table like this. But what if I showed you that you may enter measures as expressions in the ROW function?
Let’s consider another example. Here, we are going to work with the following dataset:
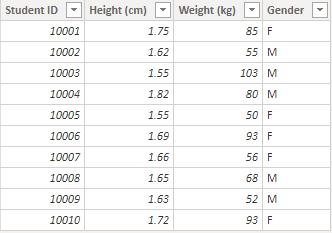
Imagine we want to create a table that will automatically calculate the average height for both male and female students. How will we go about doing this? We will have to create measures to calculate the average:
Average Height F =
CALCULATE(
AVERAGE(StudentStats[Height (cm)]),
FILTER(StudentStats,StudentStats[Gender]="F")
)
Then we will create a similar measure to calculate the average height for male students:
Average Height M =
CALCULATE(
AVERAGE(StudentStats[Height (cm)]),
FILTER(StudentStats,StudentStats[Gender]="M")
)
Now we can use the two measures and insert them into our table code:
Student Summary Average Height =
UNION(
ROW("Gender", "F", "Student Average Height", [Average Height F]),
ROW("Gender", "M", "Student Average Height", [Average Height M])
)
Power BI will create a table that looks something like this:
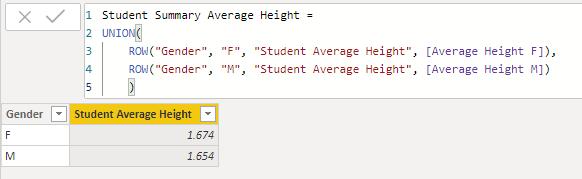
We now have a table that will automatically update the metrics each time we refresh!
That’s it for this week, come back next week for more Power BI!
In the meantime, please remember we offer training in Power BI which you can find out more about here. If you wish to catch up on past articles, you can find all of our past Power BI blogs here.