
Power BI Blog: Creating Summary Tables in Power BI
30 January 2020
Welcome back to this week’s Power BI blog series. This week, we consider the SUMMARIZE function and create customised summary tables in Power BI.
Last week, I talked about creating a rudimentary table in Power BI with the UNION and ROW functions; this week, I am going to expand on that concept using the SUMMARIZE function.
The SUMMARIZE function allows you to create a customised table directly in Power BI, without using Power Query. The SUMMARIZE function uses the following syntax to operate:
SUMMARIZE( <table>, <groupBy_columnName>[, <groupBy_columnName>]…[, <name>, <expression>]…)
where:
- <table> is a DAX expression that returns with a table of data
- <groupBy_columnName> is the qualified name of an existing column, which will be grouped based on the internal values. This parameter cannot be an expression
- <name> is the name assigned to the new column that will total or summarise data
- <expression> may be any DAX expression that returns a single scalar value, which will be evaluated multiple times for each row / context.
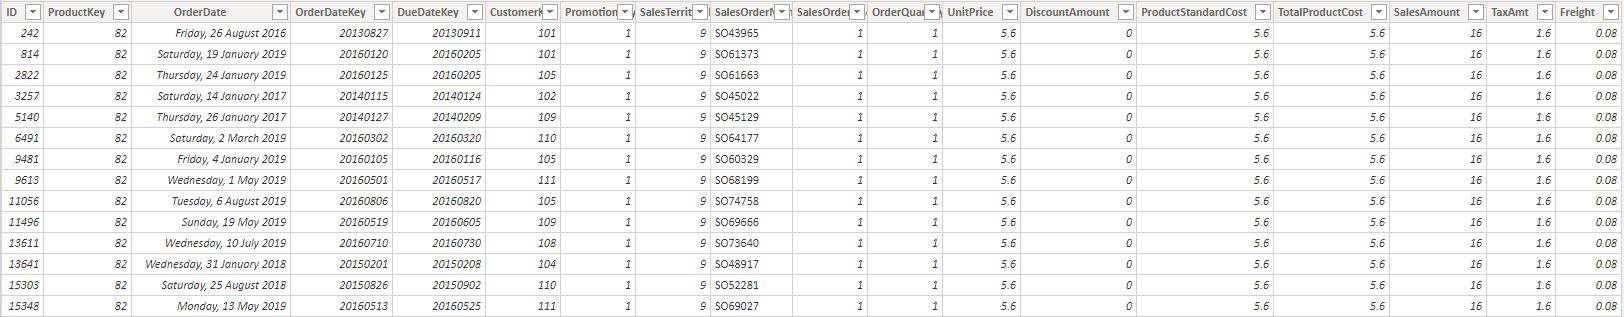
Let’s start with a simple example. We have the following table called “Sales”, an extract of which is shown below:
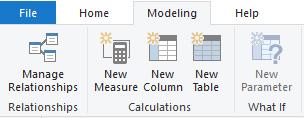
From this table, let’s create another table that summarises all of the different product keys. We can head to the Modeling tab in Power BI, then click on the ‘New Table’ option, viz.
We can use the following formula to create a table:
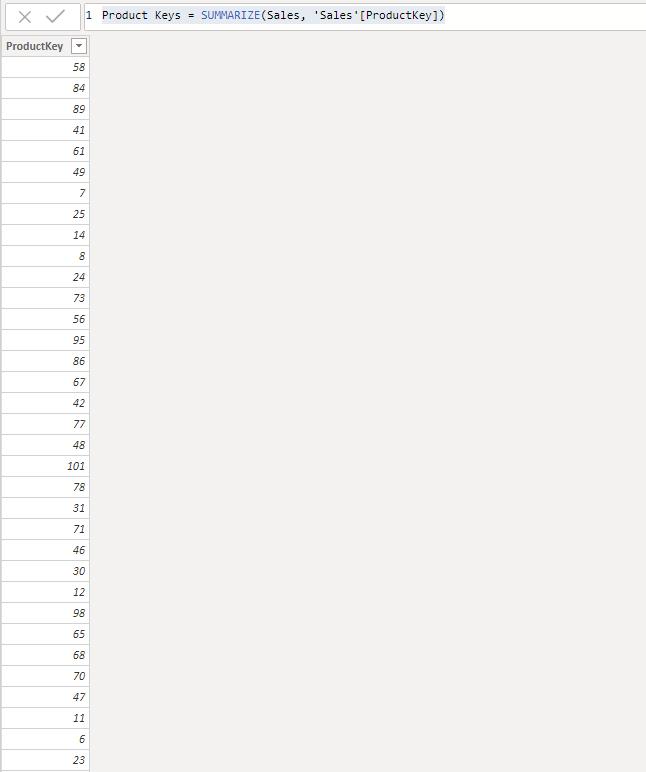
Product Keys = SUMMARIZE(Sales, 'Sales'[ProductKey])
This will generate the following table populated with all of the Product Keys in the dataset:
Not so useful so far. But what else can we do? Looking back at the Sales table, we do not have the total revenue broken down by Product Key, and we want to calculate that on a table. Therefore, we have to create a measure that will calculate the total sales for each row:
Total Sales = SUM(Sales[SalesAmount])
For food measure let’s create another for the total costs:
Total Costs = SUM(Sales[TotalProductCost])
Now we can use the following formula to create a new table:
Sales per Day = SUMMARIZE(Sales, 'Sales'[ProductKey],"Total Sales", [Total Sales], "Total Costs", [Total Costs] )
This will generate the following table:
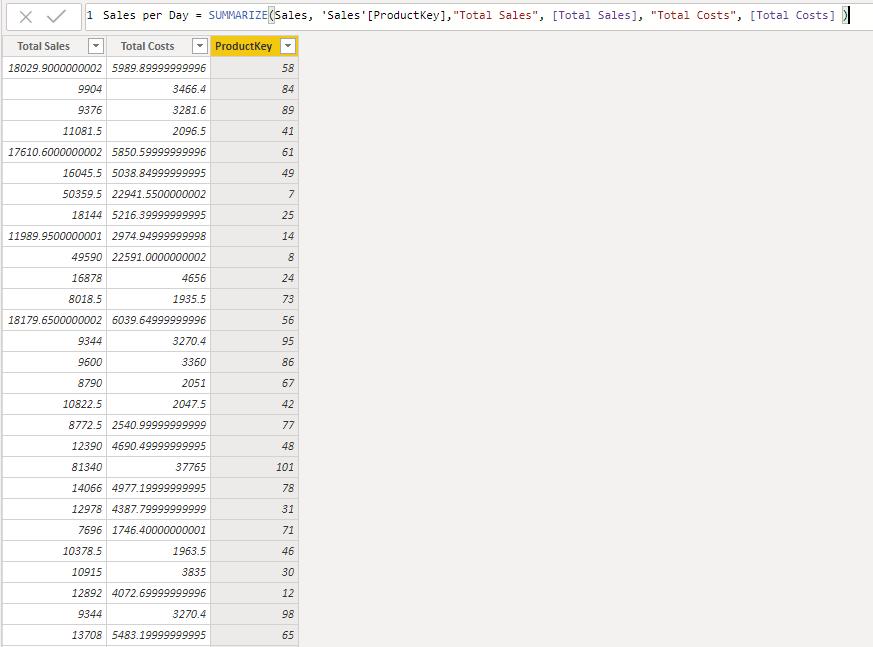
We now have a table that summarises the total sales by product key without using Power Query. We can also incorporate this table into our current data model and use it for analysis. But more on that in later blogs…
That’s it for this week, come back next week for more Power BI!
In the meantime, please remember we offer training in Power BI which you can find out more about here. If you wish to catch up on past articles, you can find all of our past Power BI blogs here.