
Power BI Blog: Gauge Visualisation – Presenting Percentages
6 May 2021
Welcome back to this week’s edition of the Power BI blog series. This week, we will look at how to use the built-in Gauge visualisation to display percentages.
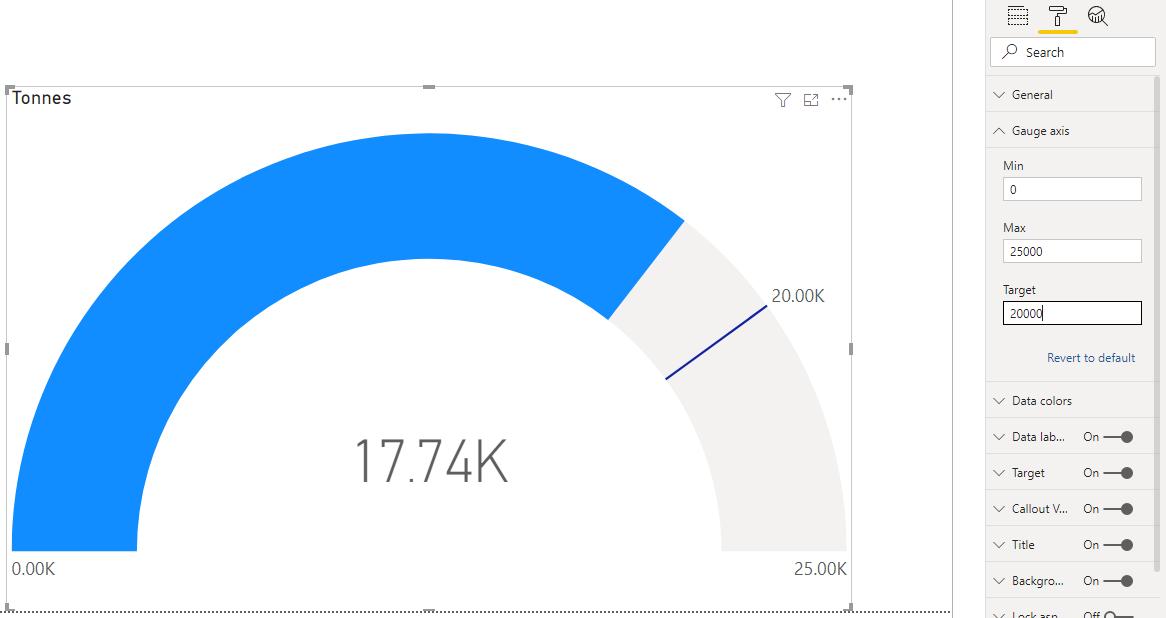
Last week, we looked at how to use the built-in Gauge visualisation. We ended up with a Gauge visualisation that could track the total amount of minerals collected throughout the month:
This week, we are going to look at using the Gauge chart to display percentages. We are going to use a slightly larger dataset than last week; this dataset will have several months’ worth of data.
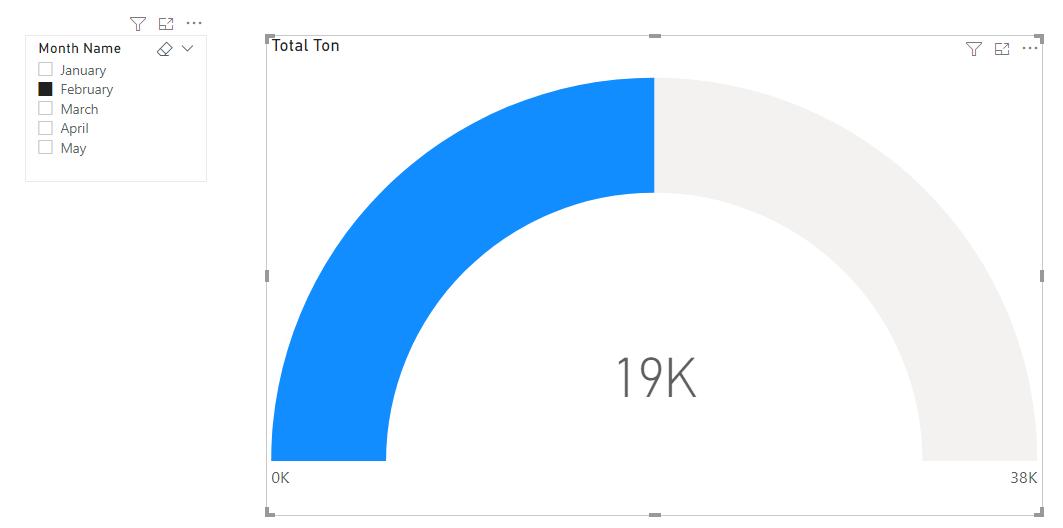
With the larger dataset we can create the following visualisation with the Month Name field as the associated slicer:
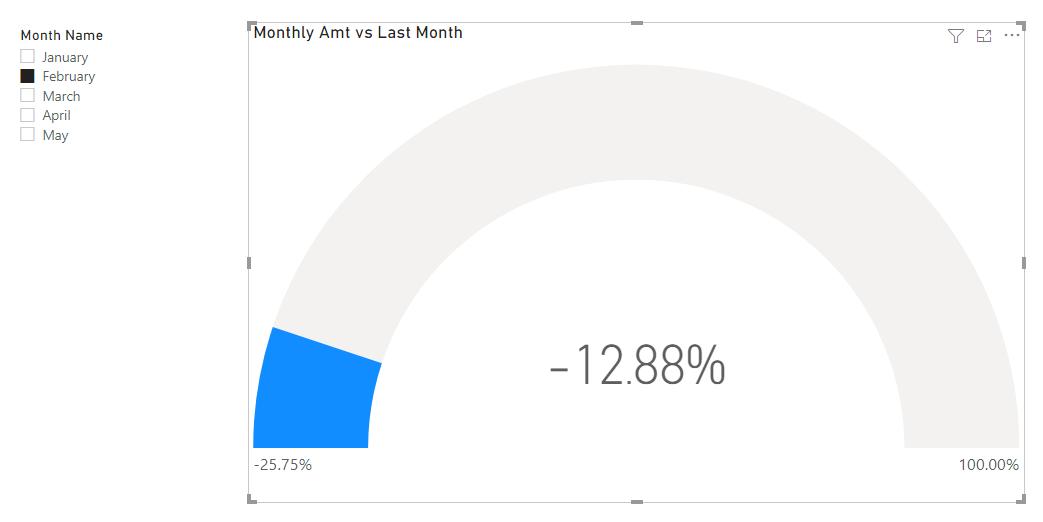
I will then write a measure that will compare the current month’s mineral collection to the previous month’s collection amount. If we select February on the Month Name slicer, we will get the following result:
Let’s apply some tweaks so it will be easier distinguish between a positive and negative percentage change. With the visualisation selected, we go to the Format tab, then apply the following values to the ‘Gauge axis’ options:
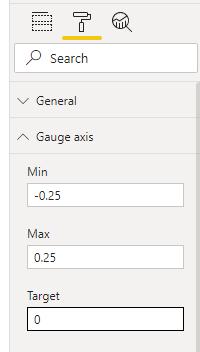
The Min and Max amounts should be equally distanced from zero [0], so that we can use zero as our baseline. The resulting visualisation will now look like this:
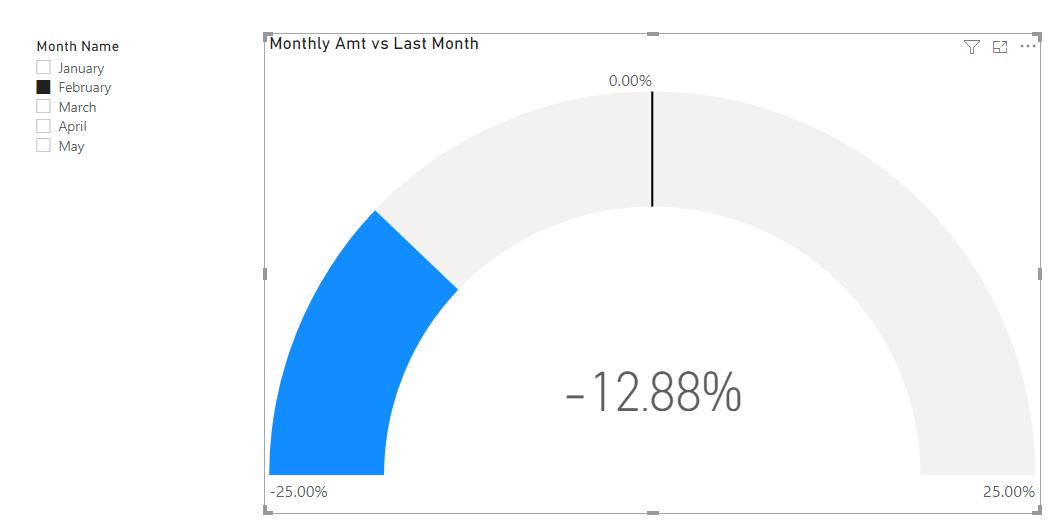
Setting the target at 0.00% sets a clear baseline for where zero is, allowing the user to easily see that we have collected 12.88%, which represents less minerals in February, compared to January.
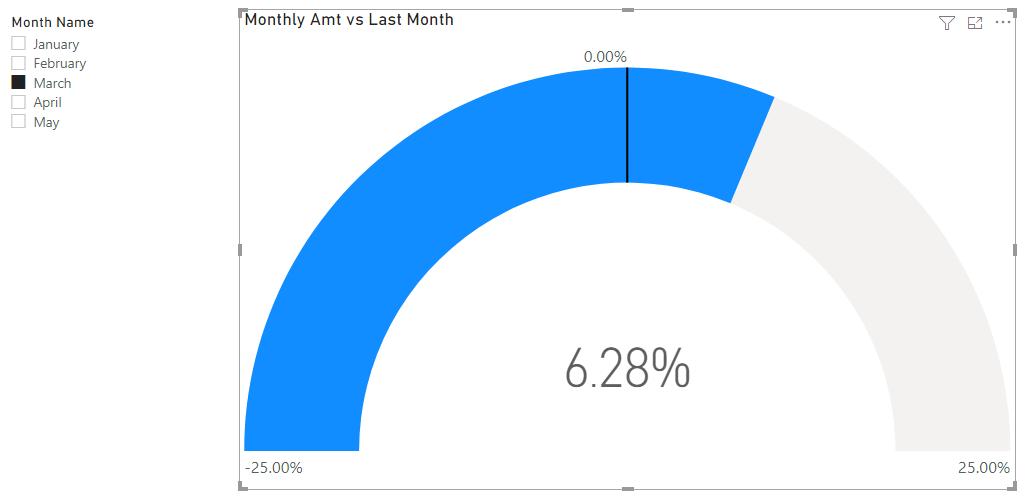
Selecting March reveals that we have collected 6.28% more minerals than we did in February:
When using Gauge charts, you should note that they only provide a snapshot of the data. Gauge charts should supplement other visualisations that better display data trends in dashboards.
That is it for this week! A quick and easy guide on how to potentially use Gauge visualisations to present percentage performance. Join us next week for more on Power BI.
In the meantime, please remember we offer training in Power BI which you can find out more about here. If you wish to catch up on past articles, you can find all of our past Power BI blogs here.