
Power BI Blog: Dating Part 6
10 February 2022
Welcome back to this week’s edition of the Power BI blog series. This week, we continue formatting the Matrix using the amended hierarchy for Calendar1.
In Power BI Blog: Dating Part 2, we generated a simple Date Table using the DAX CALENDAR() function, which we called Calendar1. We used Calendar1 to link the other tables in our simple Data Model.
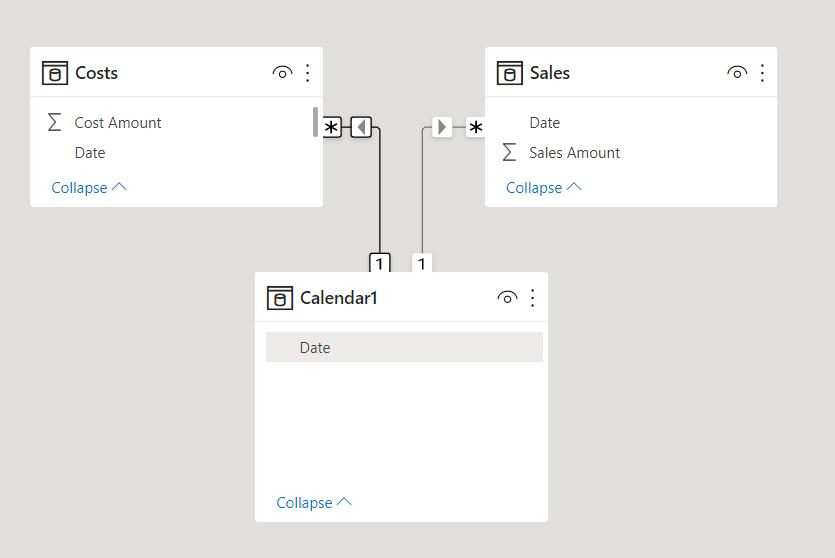
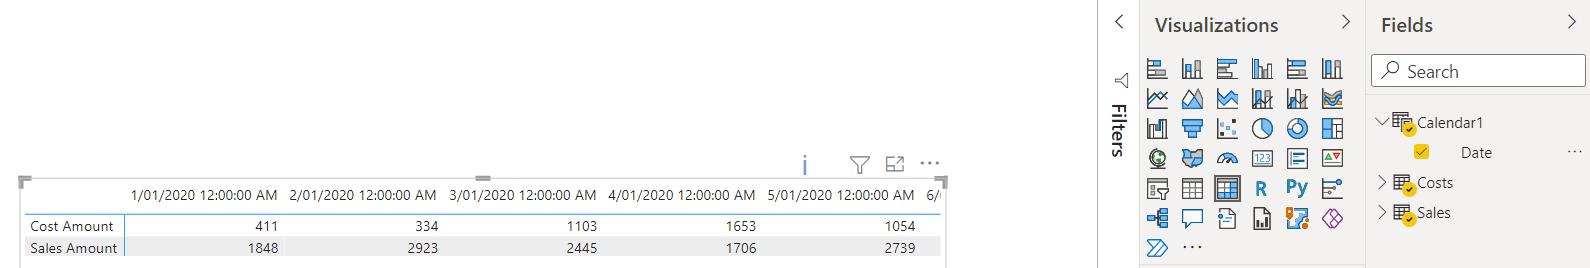
This enabled us to display the data from Costs and Sales correctly in a Matrix visualisation:
We completed Calendar 1 by marking it as a Date Table and adding more columns in Power BI Blog: Dating Part 3.
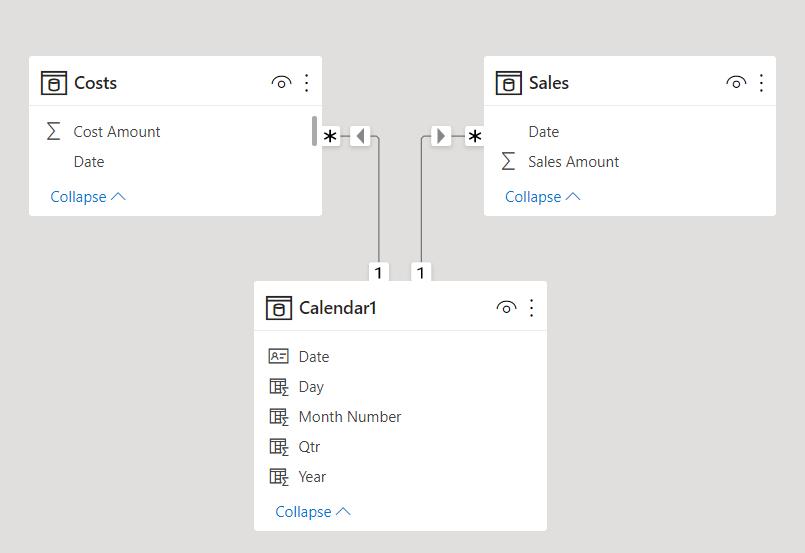
We created the Year Hierarchy in Power BI Blog: Dating Part 4:
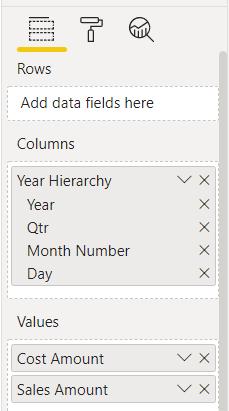
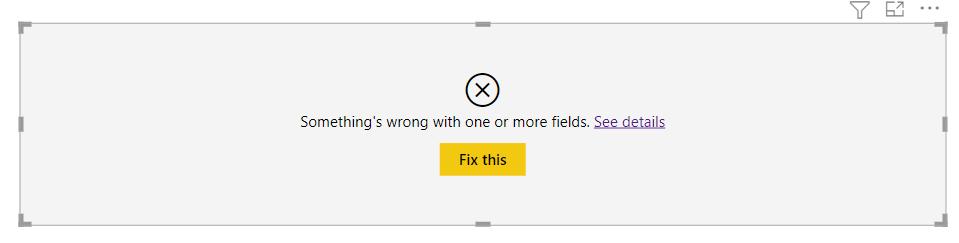
In Power BI Blog: Dating Part 5, we created a new column Month Name, and we replaced Month Number in Year Hierarchy with Month Name. Unfortunately, this didn’t quite have the effect we were looking for on the Matrix:
To see what is wrong, we click on ‘See Details’:
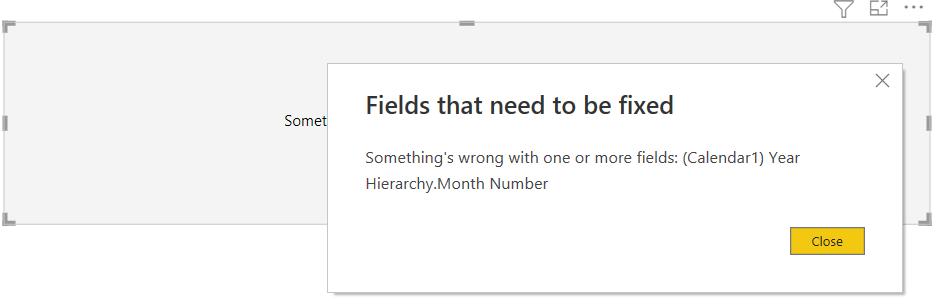
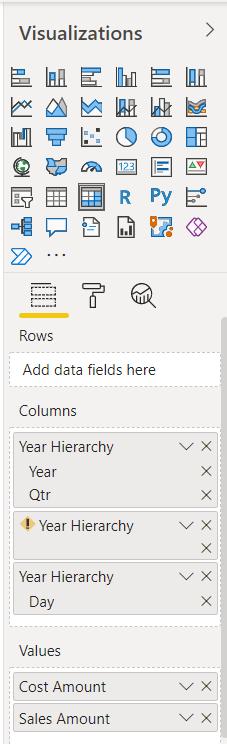
The Matrix is still expecting to use Month Number in Year Hierarchy. To fix this, we remove Year Hierarchy from ‘Columns’ in the Visualizations pane, which we can do by clicking on the cross next to the top Year Hierarchy (notice that instead of Month Number, we have an exclamation mark telling us that something is wrong with Year Hierarchy):
We can then drag the current Year Hierarchy back into ‘Columns’:
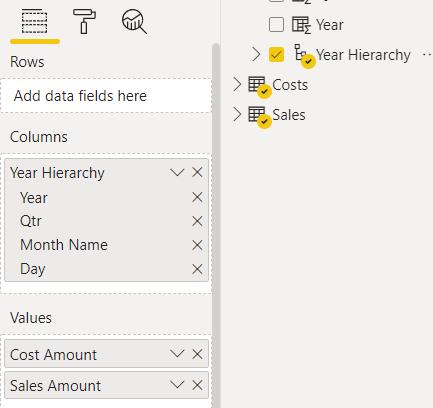
We can now view and drill down into the Matrix:
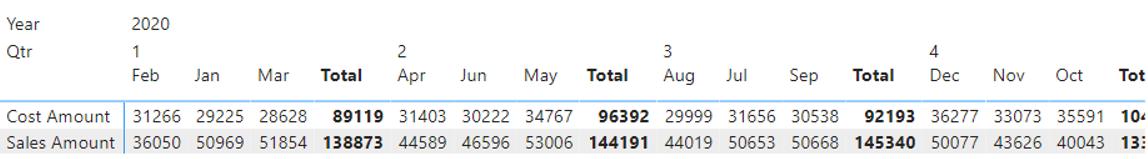
We have month names, but they are no longer in the right order. To fix this we go back to the Data view:
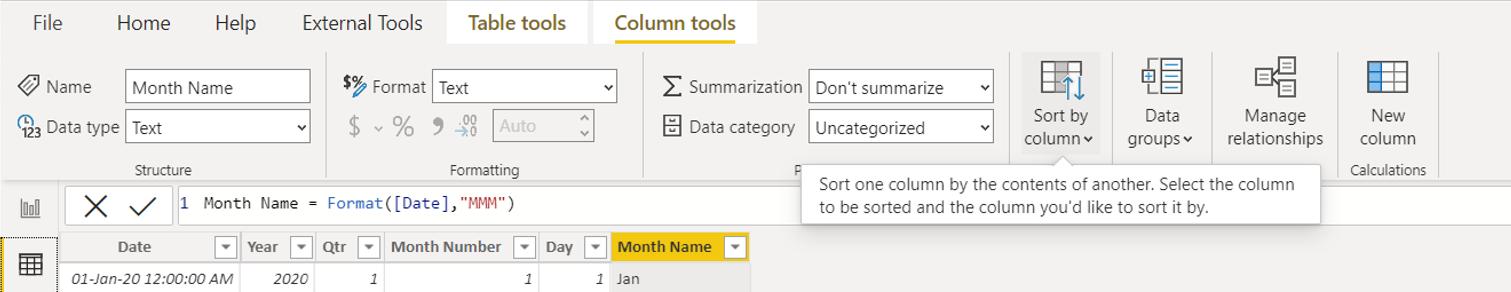
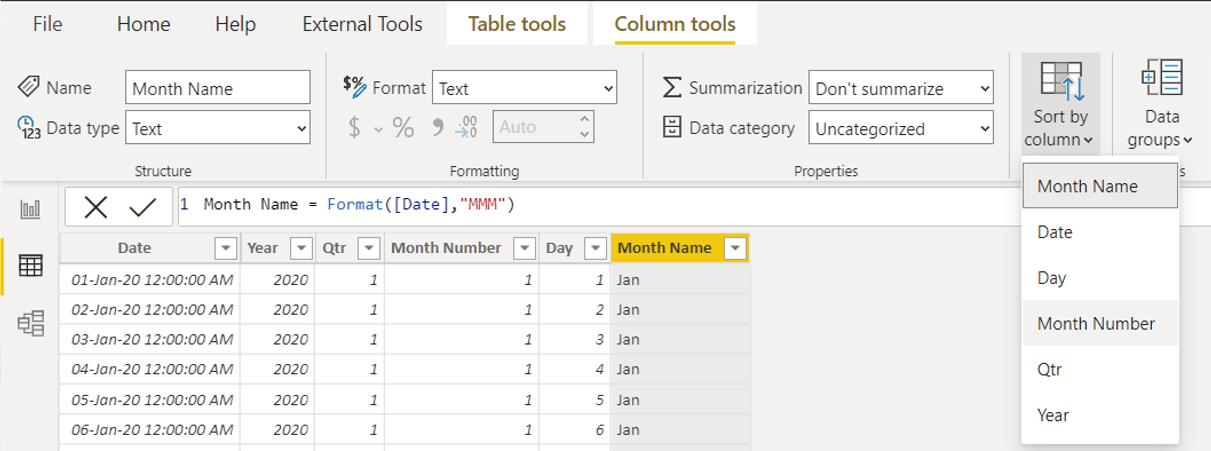
We can use the ‘Sort by Column’ dropdown and sort Month Name by Month Number:
Having done this, we can return to the Report View:
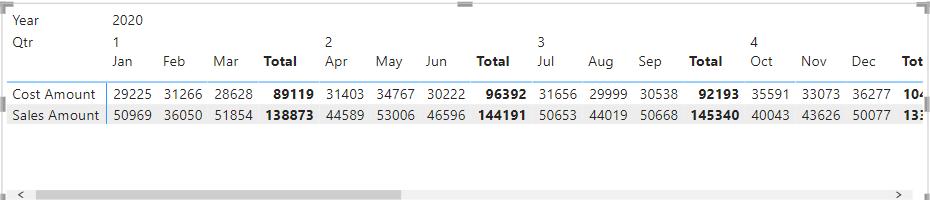
The month information is now much clearer.
Check back next week for more Power BI tips and tricks!