
Power BI Blog: Dating Part 2
18 November 2021
Welcome back to this week’s edition of the Power BI blog series. This week, we look at the DAX function CALENDAR().
A Date Table or Calendar has exactly one row (record) per day for the time period that covers the dataset in the Power BI model. The Date Table allows a date hierarchy to be applied to any table in the model, which includes a date.
Last week, we looked at the inbuilt functionality in Power BI which will create a hidden auto date/time table for every date field. If we have an accounting model where every table has at least one date, then the convenient time intelligence reporting becomes a large overhead. Having decided to turn this off, we need to create a Date Table. Let’s look at why we need a Date Table.
Our simple example below contains a model with two [2] tables, Sales and Costs.
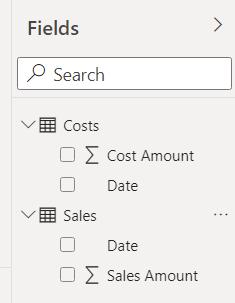
Since we have turned off the automatic generation of Date Tables, if we drag the data into a matrix, we can only see the Date:
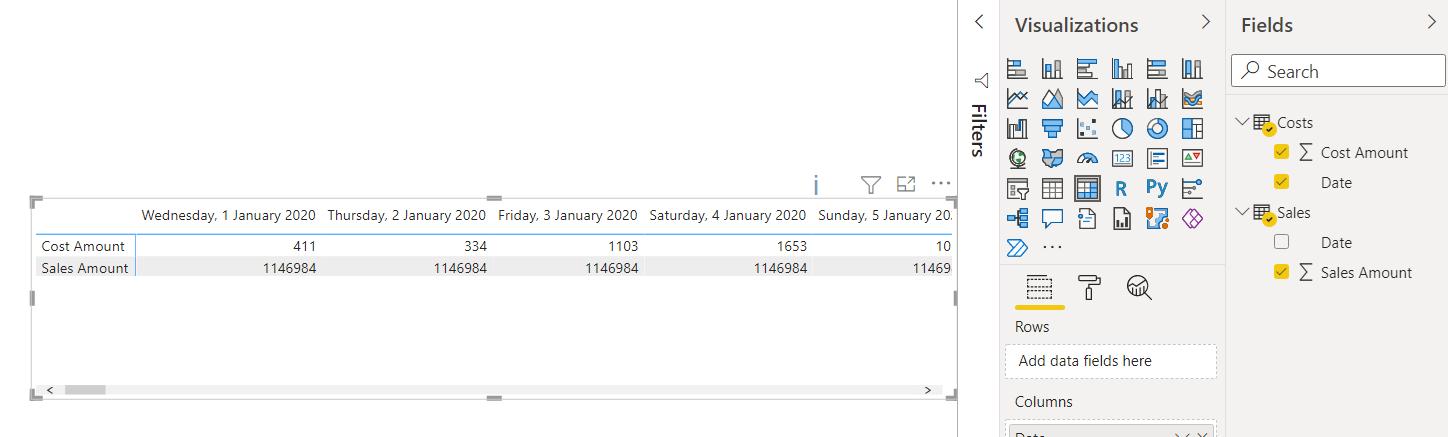
Not only that, but if those figures are correct, we are going to make a fortune! They aren’t of course. We need to create a Date Table, and then use that to link Sales and Costs.
The first method we will use to create a Date Table is by using a simple DAX function, CALENDAR(), which has the following syntax:
CALENDAR(start_date, end_date)
CALENDAR() returns a table with a single column named "Date" containing a contiguous set of dates. The range of dates is from the specified start date to the specified end date, inclusive of those two dates.
If we are going to rely on the Date Table for calculations, then the start date and end date should at least cover the time period of our dataset.
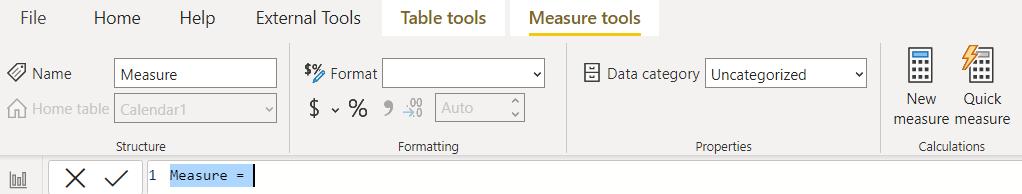
We will need to determine the start and end date, and for this we will use the MAX() and MIN() functions. We can create measures from the ‘New Measure’ button in the Calculation section on the Report or the Data tab. In both cases a new tab ‘Measure Tools’ is accessed:
We start by creating a measure Start Date using MIN():
Start Date = MIN(MIN(Costs[Date]),MIN(Sales[Date]))
This is taking the minimum of all the dates. We can create a similar measure End Date using MAX().
End Date = MAX(MAX(Costs[Date]),MAX(Sales[Date]))
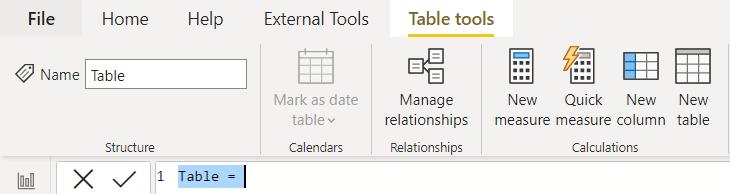
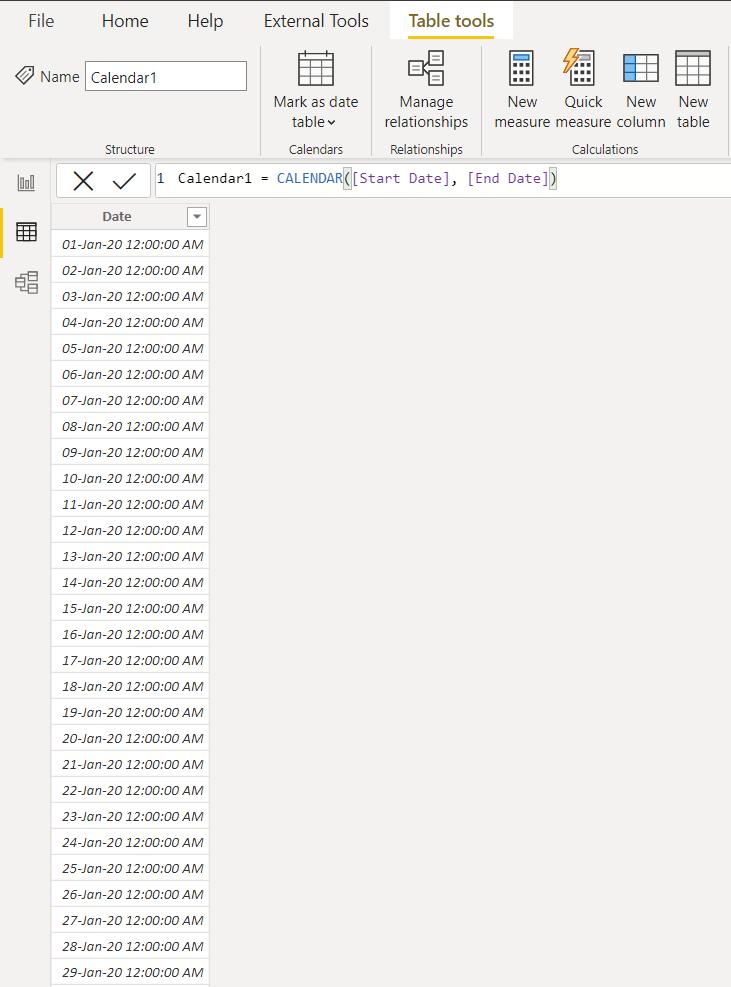
We can now create a table Calendar1 from the Data tab, using the button ‘New Table’ on the ‘Table Tools’ tab:
The DAX code we use is:
Calendar1 = CALENDAR([Start Date], [End Date])
This gives us a table with a single column Date, containing all the dates between and including Start Date and End Date:
We will need more columns in the Calendar1 table before we can drill down, but we can link the tables together now. In the Model tab, we create a relationship between Costs and Calendar1:
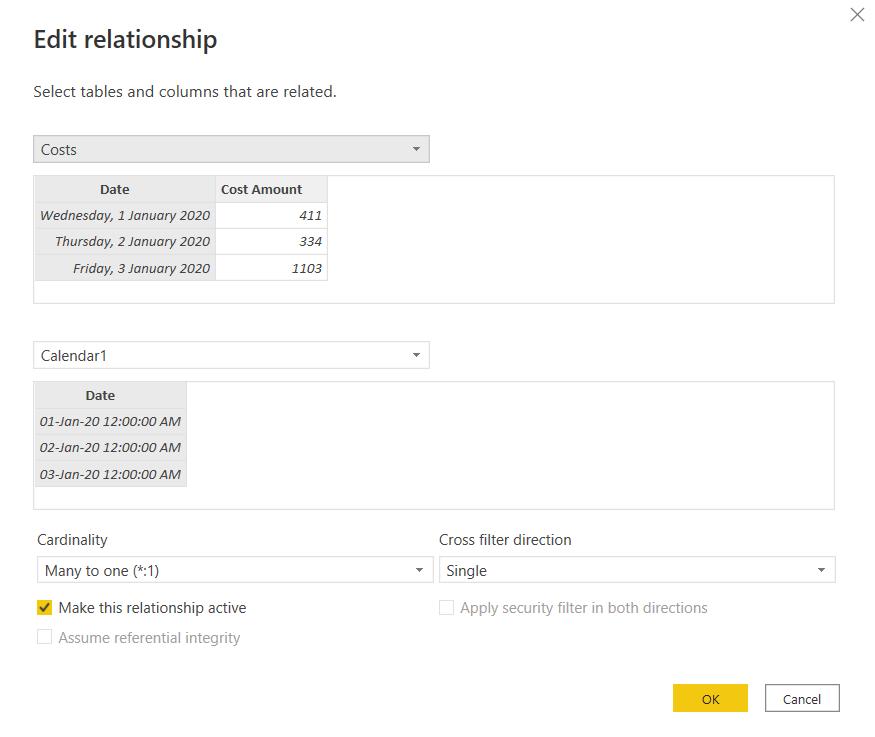
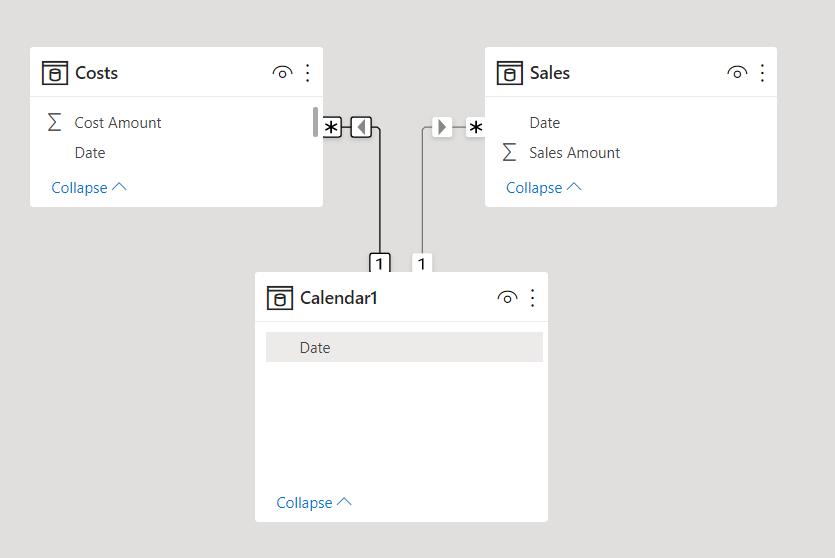
This is a many-to-one relationship, as we may have more than one cost on the same date. We create a similar relationship between Sales and Calendar1. The tables are now joined:
We can now replace the Date field in the Matrix visualisation with Date from Calendar1.
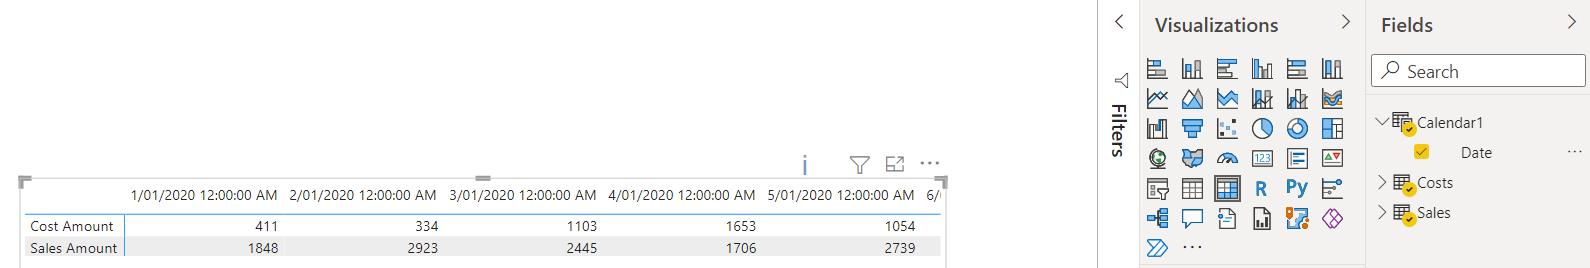
Sadly, the huge profits are no more, but the data is linked together properly. Next time, we will create the data we need to drill up and down into our data.
Check back next week for more Power BI tips and tricks!