
Power BI Blog: Explore in Power BI Service
8 February 2024
Welcome back to this week’s edition of the Power BI blog series. This week, we look at the new Explore feature in Power BI Service.
Within Power BI, many times you need to perform ad hoc exploration of your data. This could be as an analyst who just been provided with access to a new dataset or data source and wants to spend time learning about the data before building a report off it. Alternatively, you may be a business user who needs to answer a specific question using the data to include in a PowerPoint presentation, but the report you are using doesn’t answer the exact question you have. Creating a new report from scratch in these cases is a large hurdle, just to get a quick answer or screenshot for a deck.
This is where the public Preview of the new Explore feature comes in, where users have a lightweight and focused experience to explore their data. Similar to exporting and building a PivotTable in Excel, now, directly within Power BI users may quickly launch Explore to begin creating a matrix / visual pair to get the answers they need without all the distractions and extra complexity of reports.
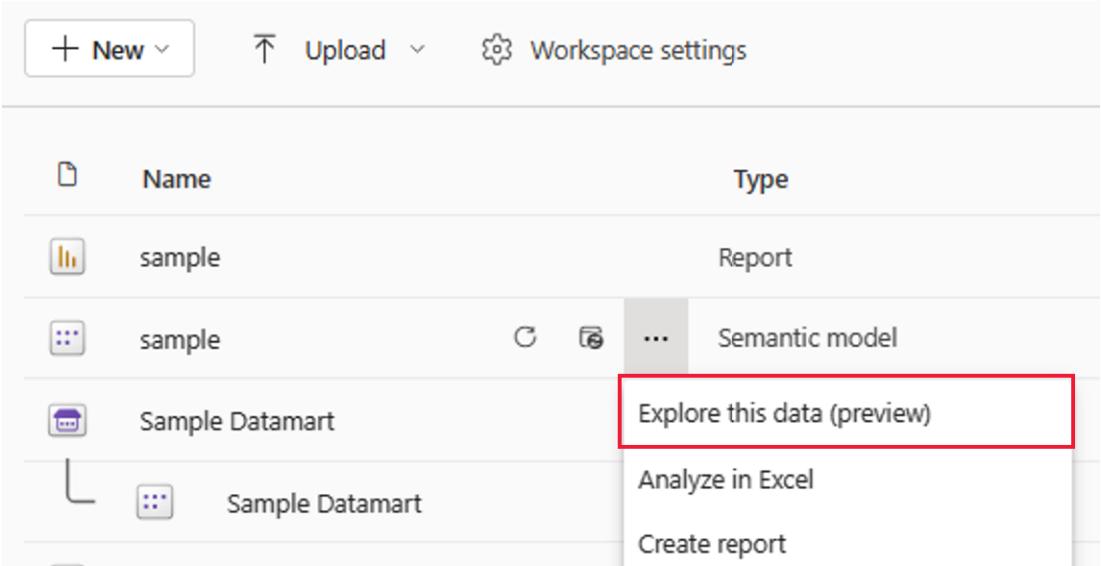
Simply find a dataset or report you’d like to explore:
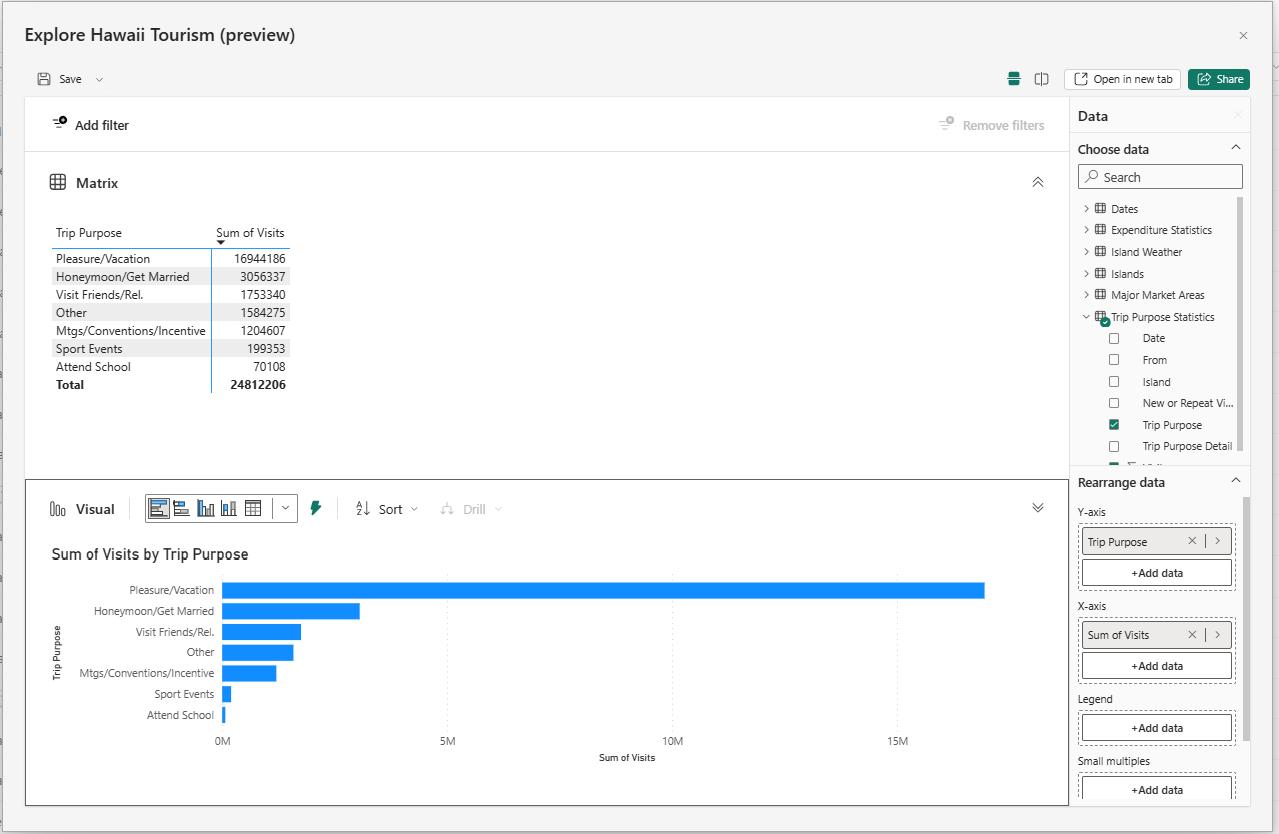
Begin building your matrix / visual pair to get to the answers you need:
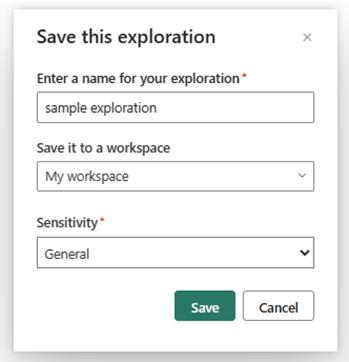
And, if you’d like to return to your work save it as an exploration:
Easy!
In the meantime, please remember we offer training in Power BI which you can find out more about here. If you wish to catch up on past articles, you can find all of our past Power BI blogs here.