
Power BI Blog: Connected Excel Tables
9 March 2023
Welcome back to this week’s edition of the Power BI blog series. This week, we look at Connected Excel Tables, in Public Preview at the time of writing.
Microsoft has recently announced a new way to explore and analyse live Power BI data in Excel. Before now, you could only analyse live Power BI data in Excel using PivotTables (with the ‘Analyze in Excel’ feature) but with this feature, you can now use Excel tables to analyse live Power BI data too.
This is presently in Public Preview, with the capability being rolled out as we write. This new connected experience enables you to export refreshable data to Excel from a Power BI visual. The data loads into the spreadsheet grid so it’s easier to use for many users. The data is refreshable because the generated Excel workbook contains a live connection to Power BI, so you can refresh the data without leaving Excel, plus this option also allows you to export more data into Excel from Power BI.
Apparently, this new ‘Export to Excel’ feature is one of many planned new connected features aimed at improving user productivity by enabling you to self-serve data while keeping your data refreshed in Excel and reducing your reliance on ad hoc static data requests.
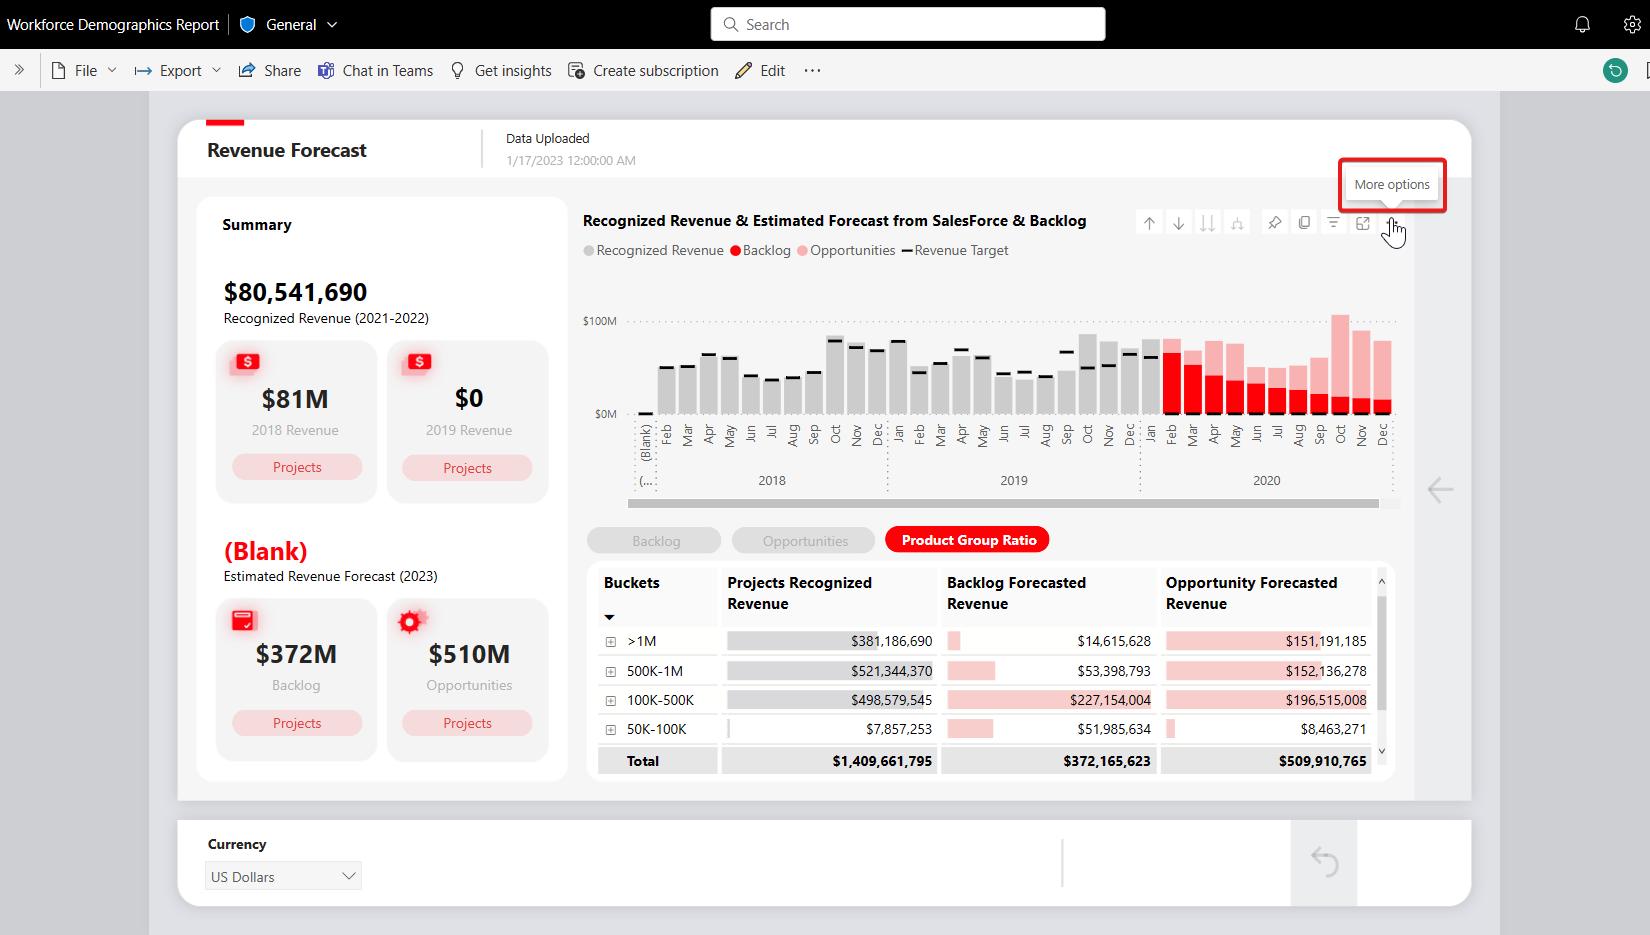
To use this feature, go to any report in Power BI Service (or https://www.powerbi.com), open ‘More options…’ on any Power BI visual and select ‘Export data’ from the menu. For example, in the following Workforce Demographics Report, let’s say you wish to analyse the ‘Recognized Revenue & Estimated Forecast from SalesForce & Backlog data’ (sic) in Excel:
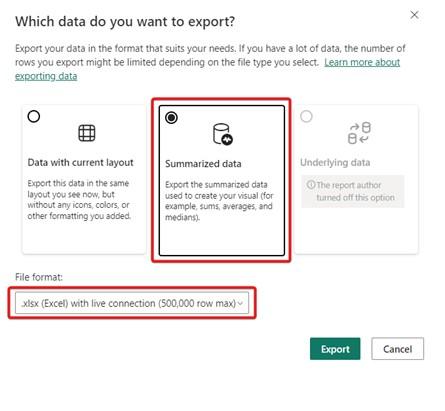
In the resulting, select the ‘Summarized data’ card and you will see a new option under the ‘File format:’ dropdown menu, ‘.xlsx (Excel) with live connection’. Do note that in order to see the new .xlsx (Excel) with live connection option, you need to have Build permission for the underlying Power BI dataset.
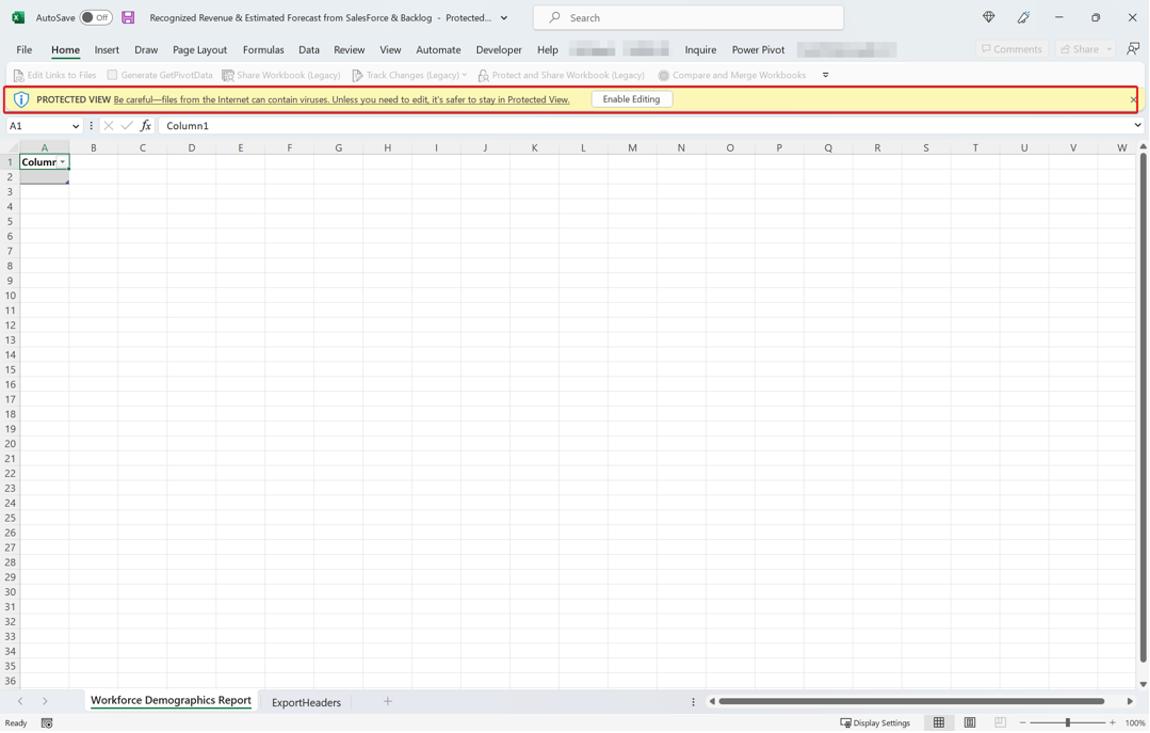
After clicking Export, an Excel workbook containing the live Power BI data is downloaded to your computer. When you open the Excel workbook, it will be opened in read-only mode until you select the ‘Enable Editing’ button in the warning message.
To load the data to the Excel grid, click ‘Enable Content’ and an Excel table is visible on the grid.
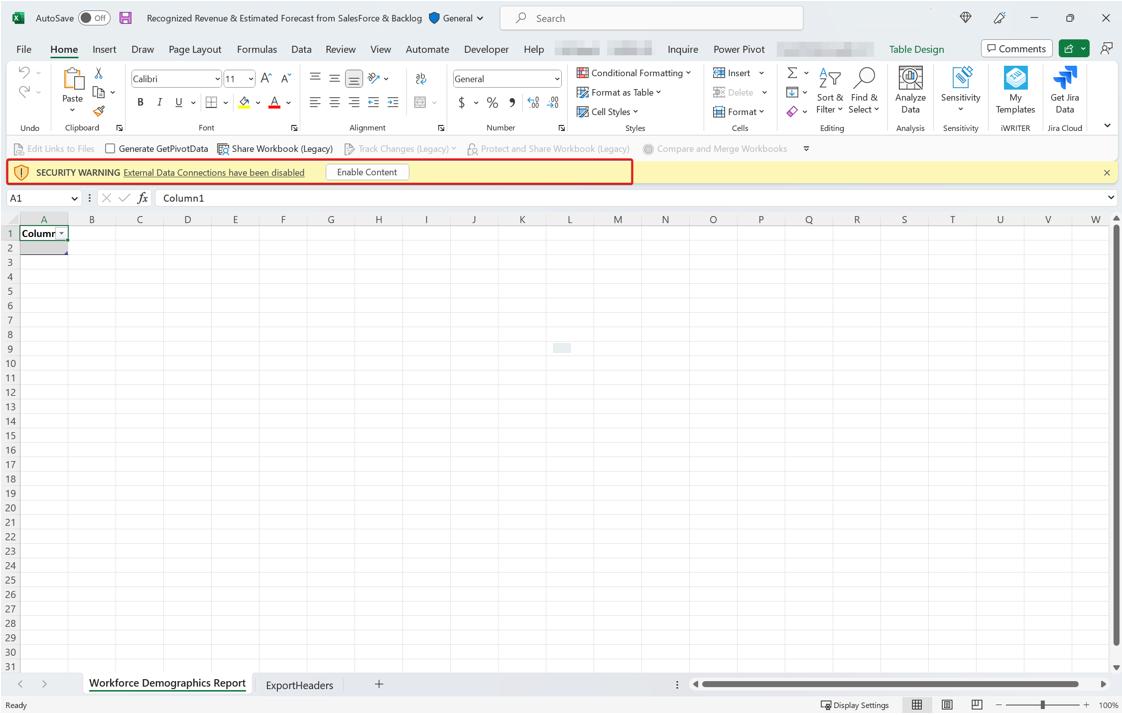
Once you click ‘Enable Content’ and the data is loaded to the Excel grid, anyone with whom the workbook is shared may view, but not refresh, the data. Before sharing the exported file with a colleague, you may need to open the file, pressing ‘Enable Content’, load the data into the Excel workbook and save the file. If you don’t, the recipient will need to have Build permission on the underlying dataset to load the data when they open the file.
Once set up, you see the live Power BI data as an Excel Table and use your familiar Excel spreadsheet formulae to perform ad hoc analysis or apply formatting to the data.
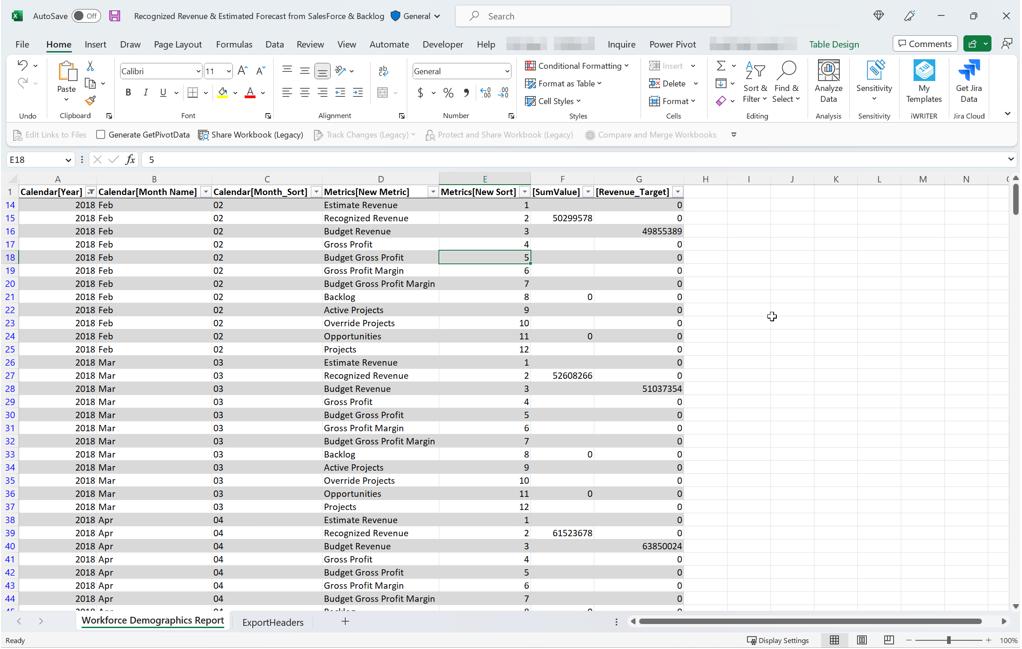
It should be noted that the ExportHeaders tab shows the filters applied to the Power BI visual from which the data was exported from. This tab is always visible on any new workbook of data exported from a Power BI visual.
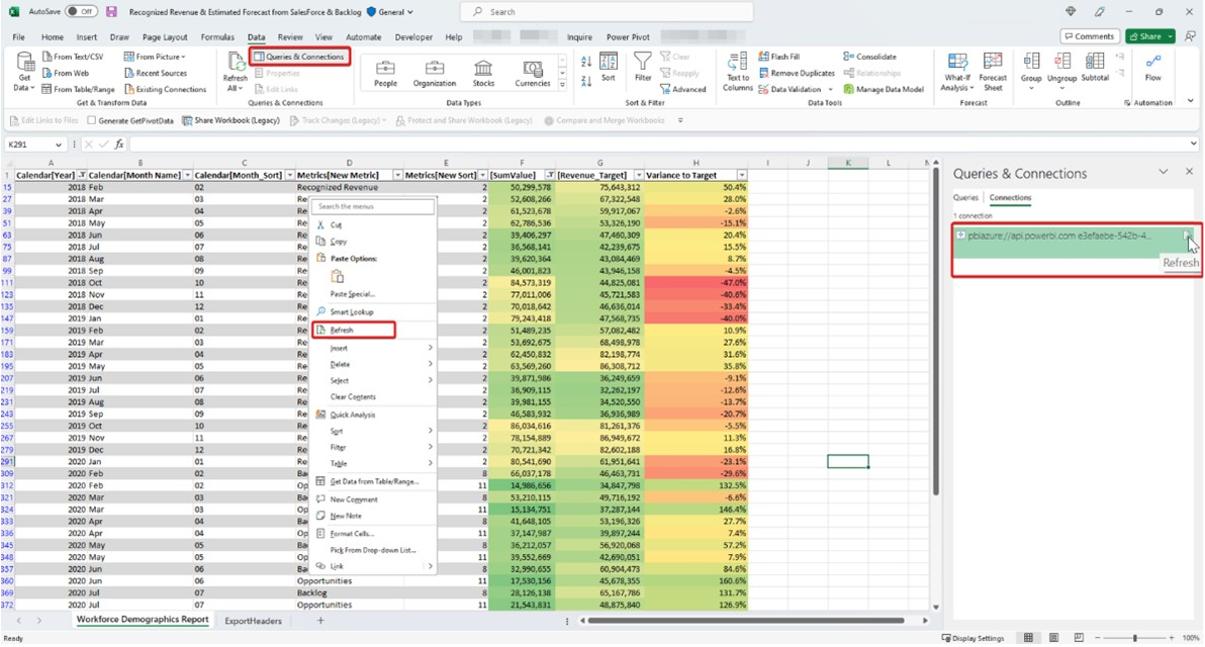
You can view the Power BI connection in the Excel workbook by clicking ‘Queries & Connections’ under the Data tab in Excel. The Power BI connection is visible in the right pane, and you can update your Power BI data by clicking Refresh in the pane or right-clicking on the Excel Table and selecting Refresh. Any formatting applied to the Excel Table is preserved after the data is refreshed.
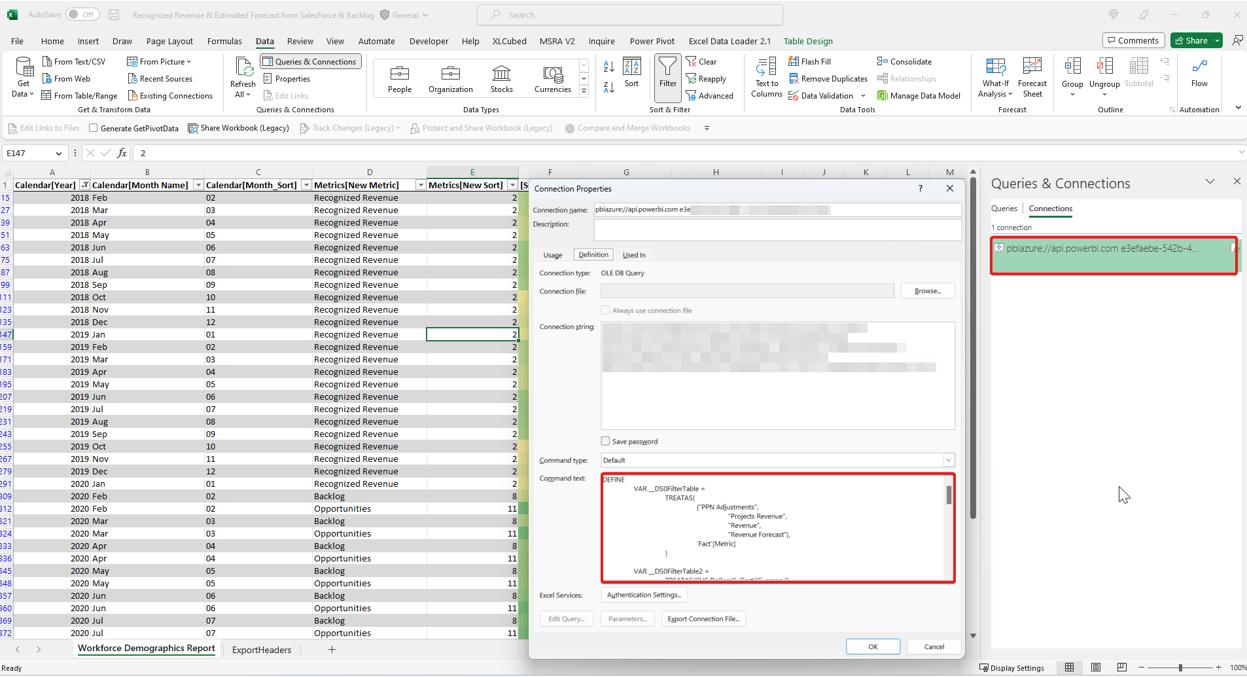
If you are feeling a little more sophisticated, you can view the DAX statement behind the Excel Table under ‘Connection Properties’ in Excel:
The new '.xlsx (Excel) with live connection' option supports up to 500,000 rows of data. This is a substantial increase over the 150,000 rows supported in static export scenarios. According to Microsoft, increasing the number of rows in export has been one of the top customer requests regarding exporting. Furthermore, since the export is live and connected, export users can be more efficient because they don’t need to recreate their analysis from scratch. Instead, they can save a copy, refresh their data, and immediately start their analysis.
The general requirements for using this feature are as follows:
- the ‘Allow XMLA endpoints and Analyze in Excel with on-premises datasets’ tenant setting has to be enabled
- you must have Build permissions to the Power BI dataset or have at least a Contributor role in a Power BI workspace
- you must have a Power BI license, such as Free, Pro or Premium Per User (PPU)
- this feature is available for use in both Excel Desktop and Excel for the web.
In the meantime, please remember we offer training in Power BI which you can find out more about here. If you wish to catch up on past articles, you can find all of our past Power BI blogs here.