
Charts and Dashboards: Recommended Charts
5 August 2022
Welcome back to our Charts and Dashboards blog series. This week, we’ll look at Excel’s recommended charts.
Sometimes it can be challenging to work out which chart in Excel best presents your data. Luckily, Excel can analyse your data and make suggestions for you using Recommended Charts.

Consider the following sales data:
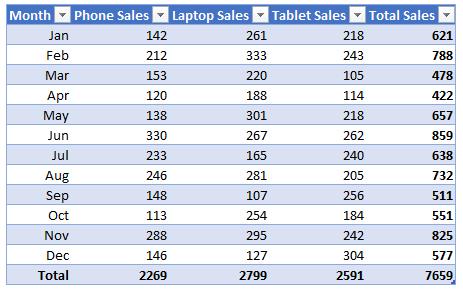
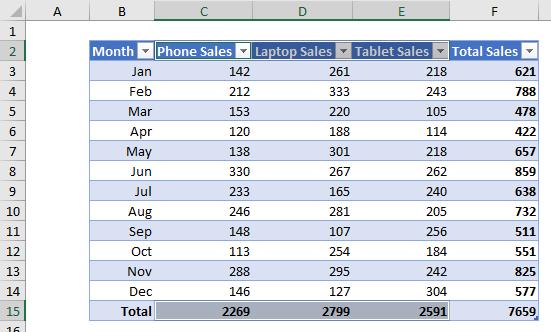
Let’s say we want to see a graph to breakdown the total sales for the year into their relevant types. We would first highlight the relevant data and headings.
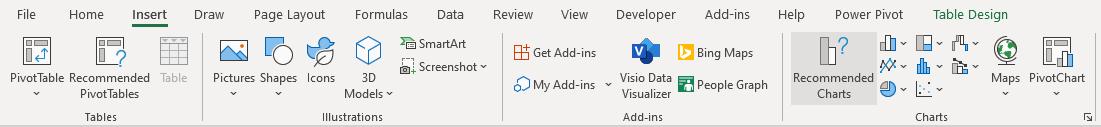
We can then navigate to the Insert tab on the Ribbon and then click on ‘Recommended Charts’.
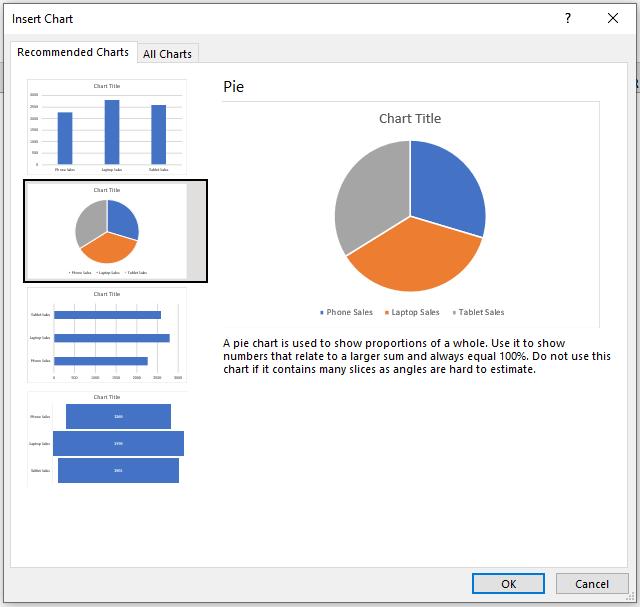
This will bring up the list of charts that Excel recommends:
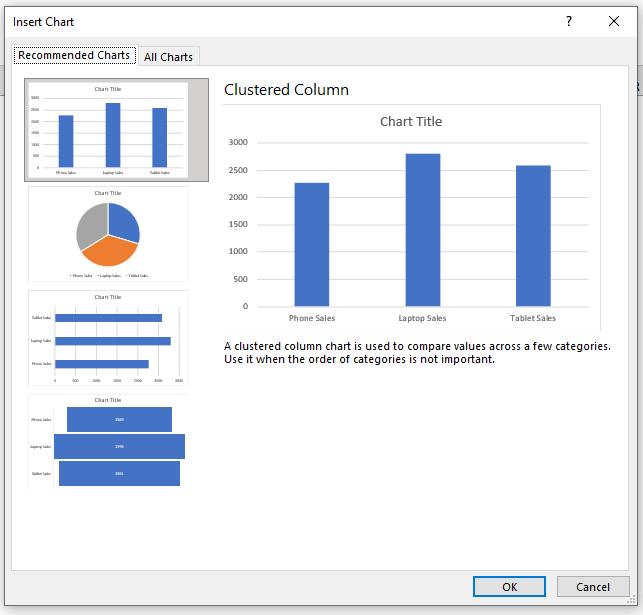
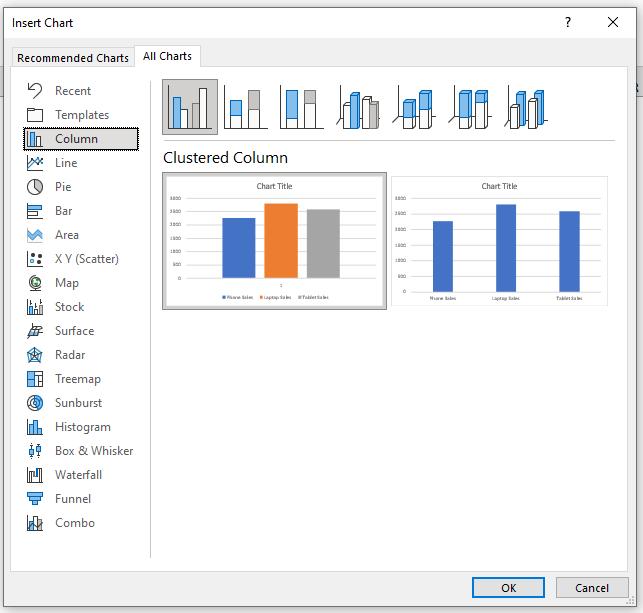
However, if none of these are what you’re looking for you can click on ‘All Charts’ at the top of this window to create a different kind of chart with this data.
I like the suggested Pie chart to represent what proportion of the whole each type of sale makes up, so I navigate to this and click OK.
This will insert the chart straight into the workbook.
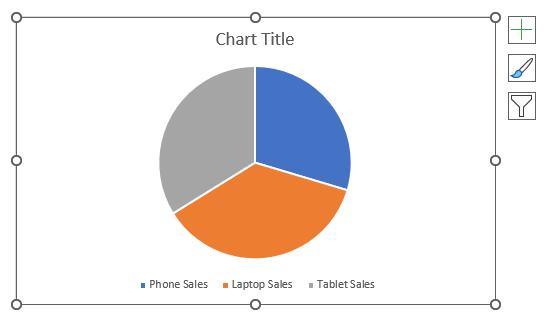
As always, this default look could do with some presentational tweaks:
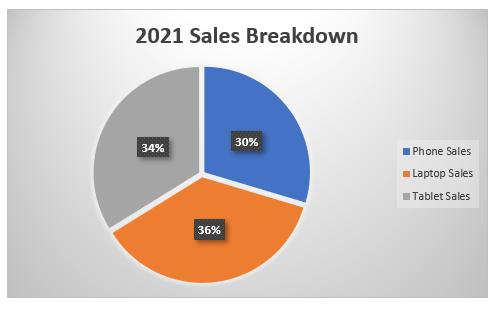
And there we have it: Excel’s recommended chart.
This is a particularly useful feature when you are unsure how best to present your data. Microsoft has spent some time programming algorithms to determine which chart may be best to visualise your data given its content. You are always free to disagree!
That’s it for this week. Come back next week for more Charts and Dashboards tips.