
Charts and Dashboards: Data Tables - Part 5
1 July 2022
Welcome back to our Charts and Dashboards blog series. This week, we’re going to cover how to create Data Tables on different
sheets than the inputs that they’re referring to.
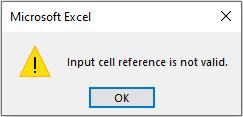
I have a saying that anything is possible in Excel. Maybe one day I may come unstuck, but today is not that day. The issue is that Excel restricts where the referred inputs must be located, i.e. they must be positioned on the same page as the Data Table. If you try and reference cells on another worksheet, or become cunning and use range names which refer to cells on another worksheet (a useful workaround on many occasions), you will encounter the following error message:
Most financial modellers will recall the mantra of keeping inputs separate from calculations separate from outputs. Data Tables force you to put outputs on the same worksheet as the inputs which can confuse end users and make it difficult to put all key outputs together.
So how can you get around this? This solution assumes that you do not wish to hide Data Tables on the input sheet and then link them to another worksheet (this is cumbersome and can make the model less efficient).
To make things more “difficult”, let’s assume that you have already built your financial model and the Data Tables are to be incorporated as an afterthought. There could be two inputs to incorporate. We will demonstrate how to create one of them (you then just follow the process twice).
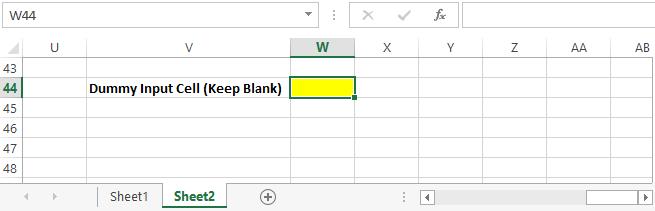
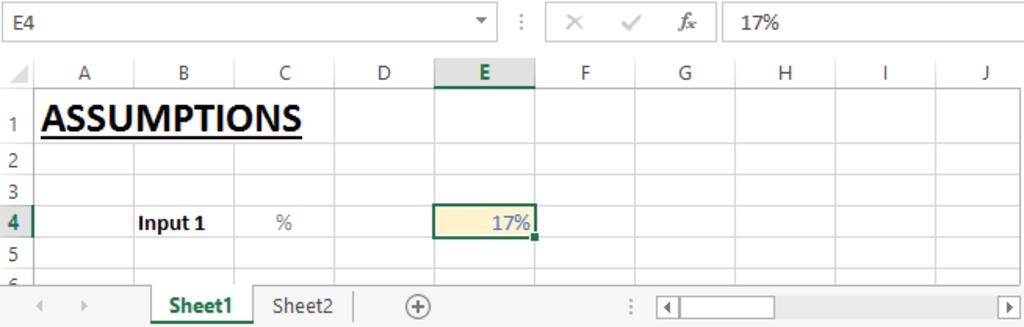
Firstly, create a “dummy” input cell on the same worksheet as the Data Table. This needs to be protected such that data cannot be entered into this cell. Let’s assume that this cell is W44 (say) on the Sheet2 worksheet, i.e.the same sheet as the Data Table.
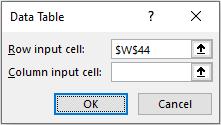
Secondly, link the Data Table (ALT + D + T) to this dummy input (in the illustration here we assume that the Data Table is a 1-dimensional Data Table:
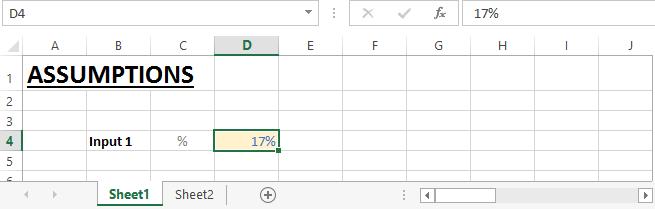
Thirdly, let us assume you actually want the Data Table to link to “Input 1” (cell D4) on Sheet1:
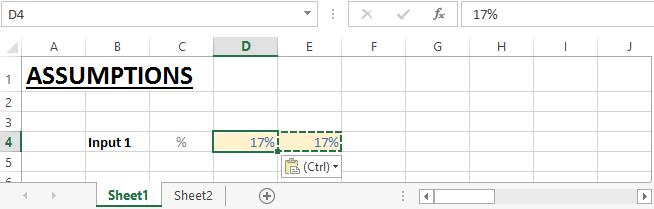
Fourthly, since we have already built the model this input will already be linked throughout the model. Since we do not wish to change all the dependent formulae, we first cut(NOT copy) the input into an adjacent cell:
Fifthly, a copy is pasted back into the original cell (here, this was cell D4):
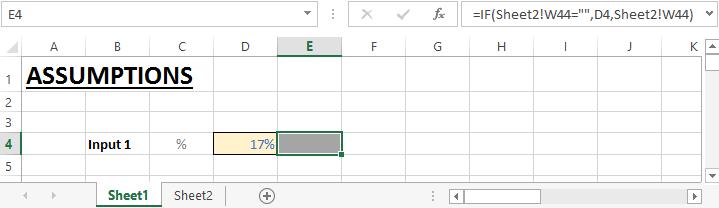
Finally, the value in cell E4 is replaced with the following formula
=IF(Sheet2!W44="",D4,Sheet2!W44)
and then formatted / protected to ensure end users do not actually type into this cell:
The Data Table will now work. This is because:
- The Data Table links directly to a cell on the same sheet as the Data Table, but indirectly to the input on the other worksheet;
- Cell E4 on Sheet1 is now the cell that drives all calculations throughout the model, even though it appears to have been added;
- Cell D4 on Sheet1 still appears to be – and acts like – the original input it replaces.
Data Tables can be really useful for executive summaries, but there are drawbacks to consider:
- Data Tables can slow down the file calculation time dramatically. For example, if you have just three 2-D Data Tables, each with ten inputs on each axis, the model calculation time could increase by a factor of up to 300 (= 3 x 10 x 10).
Microsoft has recognised this issue and allows you to change Excel’s Calculation option (found in ALT + T + O, under ‘Calculation’) to ‘Automatic except tables’. I strongly recommend you do not implement this option. End users tend to assume Excel is always calculating everything automatically and some do not know how to check / modify this functionality.
Instead, we should build in ‘On / Off’ switches next to the Data Tables themselves. These are transparent and intuitive and have the same effect; and finally - This approach may not work where formulae dependent on the input cells selected use OFFSET or INDIRECT. The technique can still be employed, but it may be safer not to cut and paste but add an input cell elsewhere instead.
That’s it for this week. Come back next week for more Charts and Dashboards tips.