
Spotting Inconsistencies and Plugs
As a professional modeller for more years than he’d care to admit Liam Bastick highlights some of the common mistakes prevalent in financial modelling / Excel spreadsheeting. This article considers how to spot where a modeller might be trying to get one over the end user…
A Common Scenario
You have received a model and you have been charged with reviewing the financials. As you undertake ratio analysis, you identify some formulae have been replaced with hard coded numbers to make the Balance Sheet balance (or vice versa). Now you’re worried. How can you determine if calculations are consistent or whether you have balancing formulae in certain cells?
If you have a block of calculations, model formulae should be consistent. Indeed, I advocate wherever possible use only one unique formula across a row or in a block of calculations. End users often see “one-off” formulae as plugs in data and it can lead to mistrust of a model. Using fewer unique formulae makes models more “trustworthy”, easier to understand and quicker to review – and cheaper to audit!
But how do you check formulae have been copied correctly?
Example
Consider the following block of data:
Example Block of Data
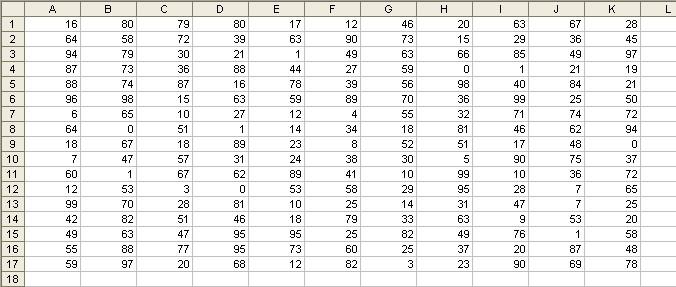
Let’s assume this data is supposed to refer to a similar block of data elsewhere. How can we tell if the formula has been copied across and down correctly? Inspection by eye achieves nothing here.
One option is to use the keyboard shortcut CTRL+` (the character is the key to the left of the 1 on a standard QWERTY keyboard):
Block of Data with Formulae Displayed
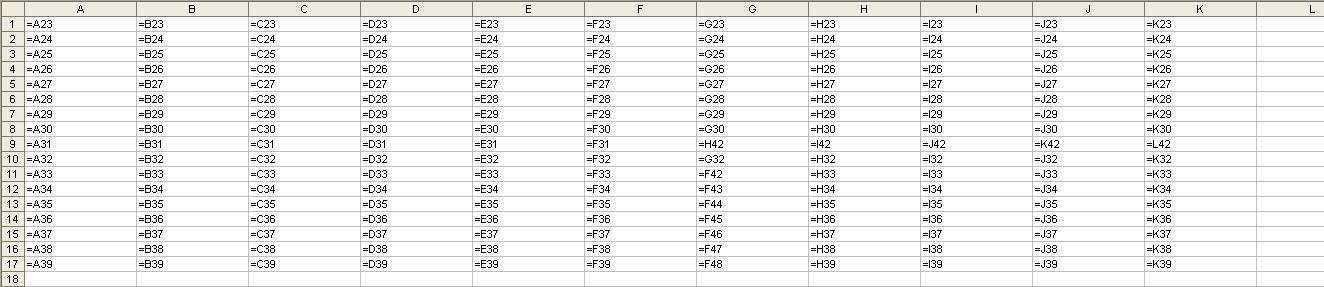
This shortcut toggles cell values with their content (i.e. formulae). This will show formulae which have not been copied across properly, but this is still fraught with user error (can you spot the relevant cells?) and would be cumbersome with vast arrays of data.
Instead, there is a simpler, automatic approach. Select all of the data (click anywhere in the range and press CTRL+*). Then use the keyboard shortcut CTRL+\ viz.
Inconsistent Formulae
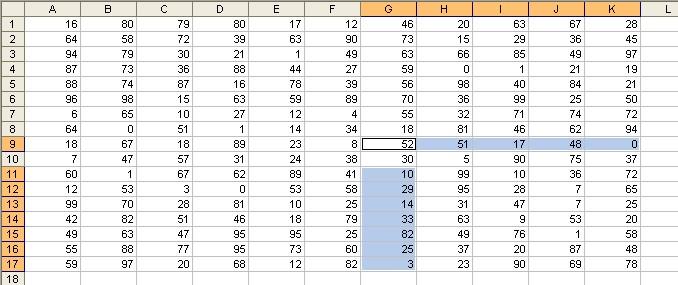
This automatically selects all of the cells whose contents are different from the comparison cell in each row (for each row, the comparison cell is in the same column as the active cell). With the cells highlighted, it is easy now to shade them for further examination.
CTRL+SHIFT+\ selects all cells whose contents are different from the comparison cell in each column (for each column, the comparison cell is in the same row as the active cell). In this example, where a formula is supposed to be copied across and down, there will be no difference.
Sometimes, you need to identify where formulae have been used in a range where you were only expecting values. This can be achieved using the ISFORMULA function in conditional formatting in Excel 2013 onwards, but there is a simpler way that works in all versions of Excel.
The ‘Go To’ dialog box (CTRL+G or F5) has the answers. Simply highlight the range to be reviewed (it may only be used one worksheet at a time) and then summon the ‘Go To’ dialog box:
Go To Dialog Box
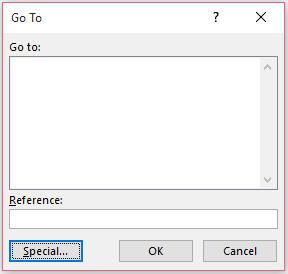
Not many notice the ‘Special…’ button in the bottom left hand corner. Clicking this button generates the following dialog box:
Go To Special Dialog Box
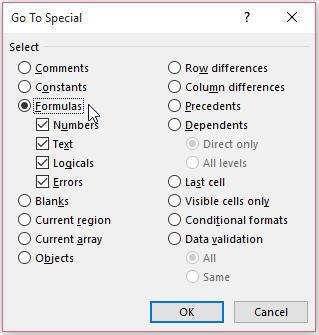
Selecting the ‘Formulas’ radio button activates the four check boxes directly beneath it so that the types of formulae sought may be filtered. Clicking ‘OK’ once satisfied selects all cells meeting these criteria in the range and these may then be shaded for further review / amendment as necessary.
Word to the Wise
I have concentrated on rogue formulae in this article, but the checks may be reversed or even extended. F5+Special may be used to locate constants (i.e. “plugs”) instead, as well as to locate particular types of data validation and conditional formatting. It’s a neglected functionality in Excel, extremely useful and highly recommended!