
Rolling Charts
This month, in our series of articles providing solutions to common issues encountered by finance professionals, we look at how to update rolling budgets graphically – and automatically: you just have to roll with it. By Liam Bastick, director (and Excel MVP) with SumProduct Pty Ltd.
Query
How can I create a rolling chart automatically, i.e. a chart that displays just the last 12 months and updates as new data is entered?
Chart Data and Tables
Many analysts and accountants need to keep a rolling budget going and I have proposed my solution here, but few articles seem to exist about to make charts automatically update for the latest information. I keep getting asked if there are non-VBA solutions and the simple answer is, of course there are! And here’s one…
Before I start though, I want to back up a step and give you a general tip about chart data. Let me explain. Consider you had some financial data similar to the following:
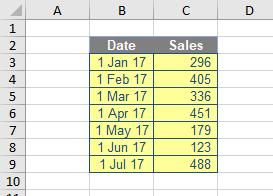
Highlighting the data (here, cells B2:C9) and using the keyboard shortcut ALT + F1 produces a quick and dirty chart, viz.
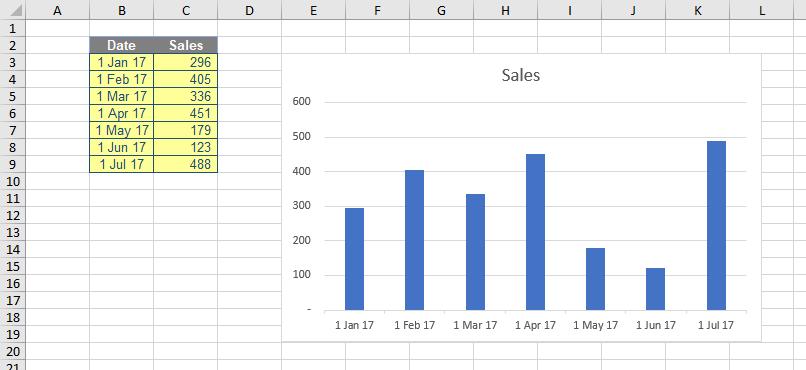
Believe it or not, that’s not the chart tip, although many people are impressed when they see that for the first time. However, the novelty starts to wear off, when you add the next period’s data and nothing happens:
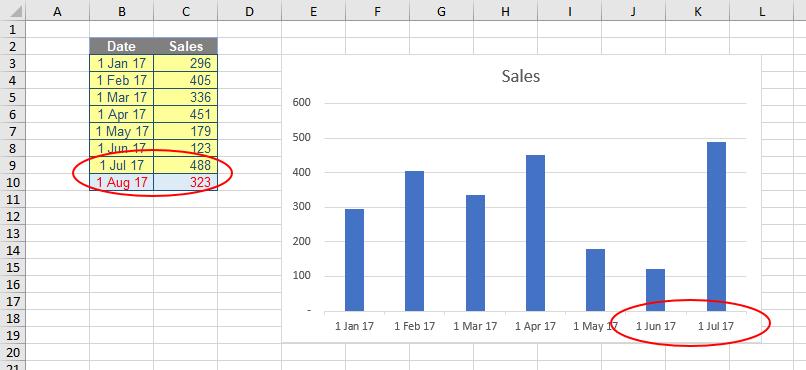
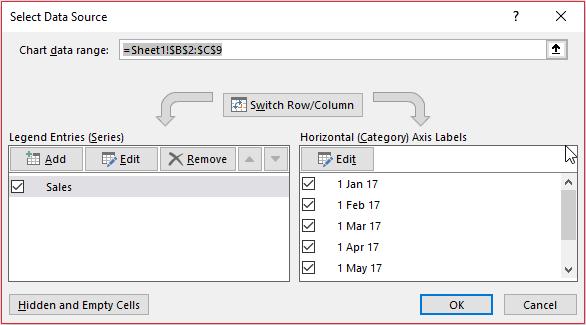
Most of us have been there and bought that t-shirt. Therefore, with a heavy heart, you right-click on the chart and choose ‘Select data…’
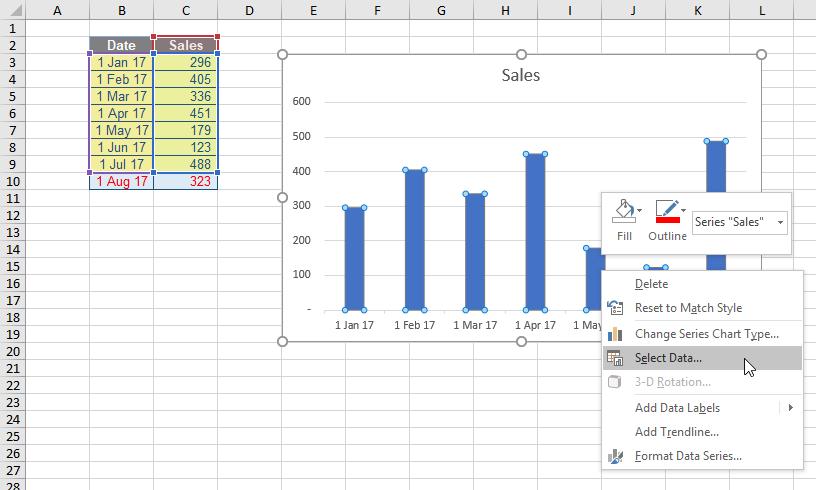
and from the resulting dialog box you update the date and sales references:
Surely there is a better way? Yes there is – and don’t call me Shirley…
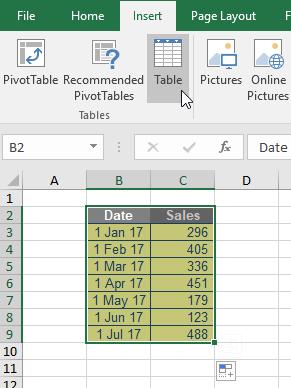
Let’s back up. After entering the data and before creating the chart, convert the data range to a Table (CTRL + T, or from the ‘Insert’ tab on the Ribbon, choose ‘Table’ from the ‘Tables’ section):
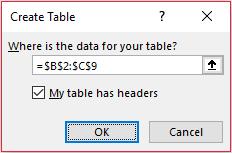
Ensure the ‘My table has headers’ check box is ticked in the ensuing dialog box:
Now add a chart as before, but this time, when additional data is added the chart automatically updates:
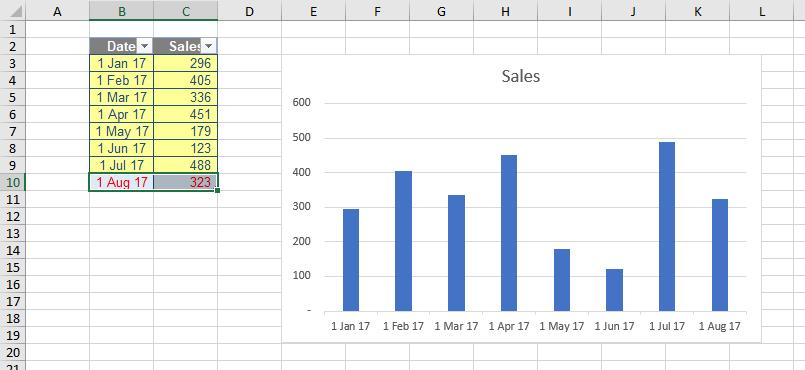
How good a trick is that? Therefore, I have a rule with chart data: always put it in a Table before creating the chart. It just makes life easier.
Rolling Charts
A “rolling” chart is just like a rolling budget: it displays the last x months (typically, the past 12 months), but keeps up to date automatically. The idea is similar, but not quite the same, as we do not wish to extend the range, simply keep moving the 12 months along the time axis.
To do this, you still create a Table (mine is labelled ‘Chart_Data’):
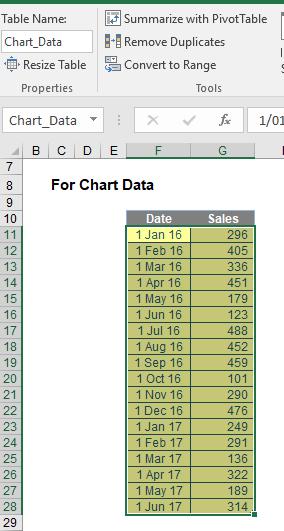
I then calculate the latest date in the formula by typing =MAX( and then highlighting cells F11:F28 in my example. This gives me the formula
=MAX(Chart_Data[Date])
(the syntax will be slightly different if you are still using Excel 2007). The great thing about this formula expressed in this way is as the dates extend, the range will update automatically. I use this formula in the final row of a second table (check out cell L22 in the image below):
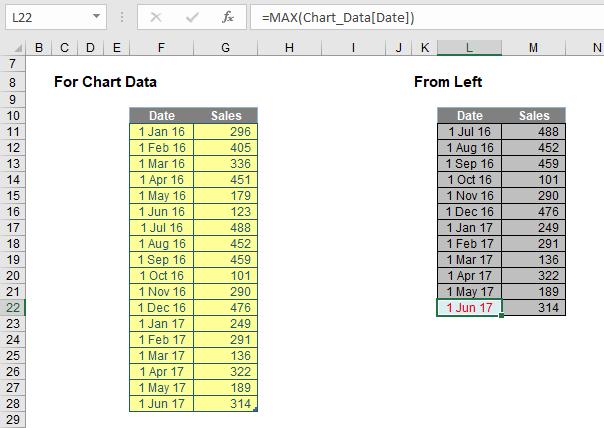
To populate the rest of the data in column L, in cell L21 I write the following formula
=EDATE(L22,-1)
This generates the same day of the month one month earlier. I then copy this formula into cells L11:L20. Finally, I use a LOOKUP formula to derive the Sales data. For example, the formula in the final period here is
=LOOKUP(L22,Chart_Data)
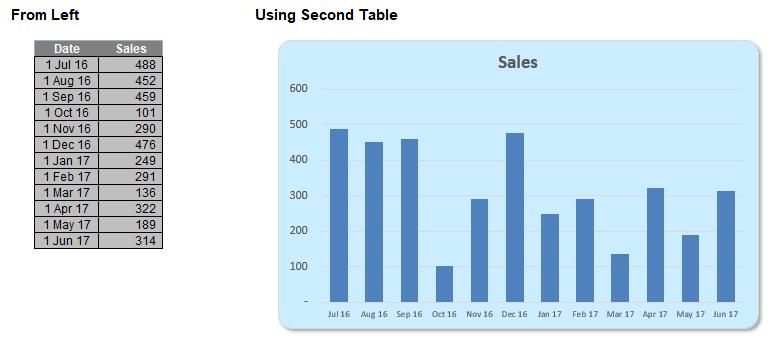
Here, the LOOKUP formula will always look for the date in the first column of Chart_Data and return the value in the final (second) column. You should note that this chart data table is always 12 rows deep for a 12 month look-back. If you need a rolling budget for a different duration, simply amend the number of rows accordingly. It is this table that populates the chart:
It's pretty straightforward and this example is included in the attached Excel file. This file also adds more complexity in other examples by considering:
- the last 12 months where Sales data is available (i.e. where dates may already have been entered but sales are blank) and
- the last 12 months of non-zero / non-blank Sales data (when there may not be sales in each month).
These ideas are a little more sophisticated, but the same ideas remain. Check them out for yourself.