
Smart Narratives (Preview) Comes to Power BI
24 September 2020
We don’t normally make updates to Power BI news items, but we think this one is a worthy exception.
Frequently, users will use PowerPoint, text boxes, interactive headers or custom visuals to add narrative to their data. All these options either lack interactive data, interactive and customisable text or useful automatic insights. This Preview of Smart narrative visual can help users with this. The Smart narrative visualisation helps you quickly summarise visuals and reports by providing relevant out-of-the-box insights in a customisable fashion.
Using this feature creators can add narratives to their report to address key takeaways, point out trends, and edit the language and format it to fit a specific audience. Instead of pasting a screenshot of their report in PowerPoint with key takeaways added, you may now add narratives to the report that are updated with every refresh. End-users may use the narratives to understand their data, get to the key points faster and explain the data to others.
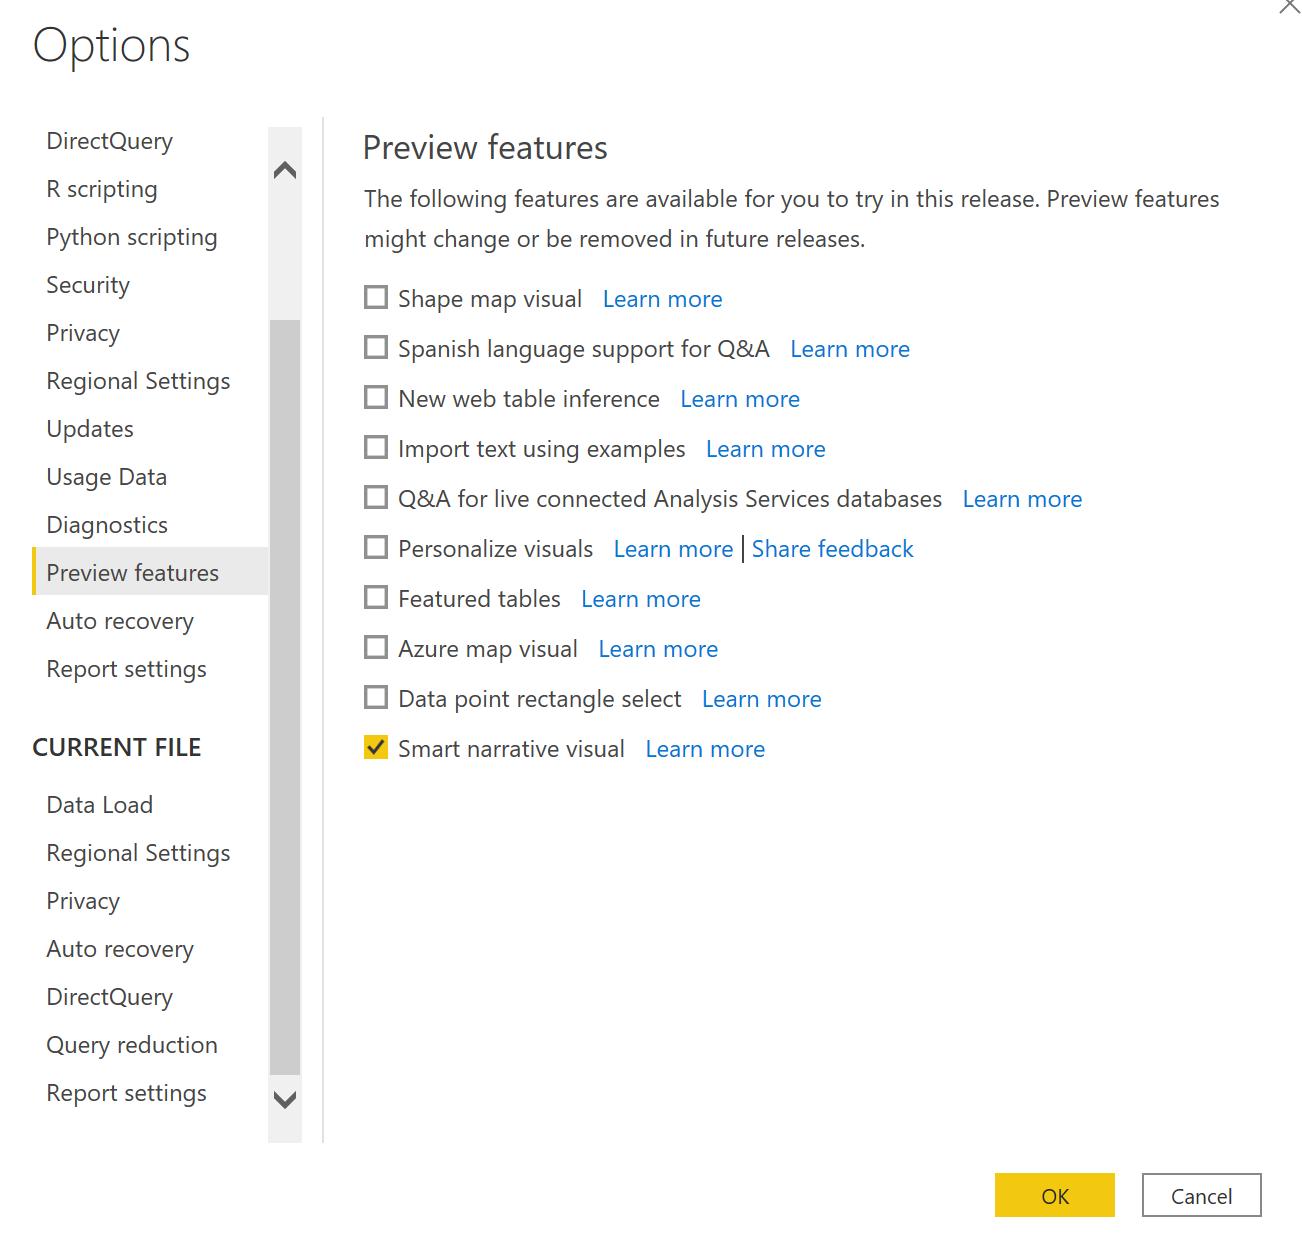
Since this feature is in Preview, you will need to first turn on the feature switch by going to File -> Options and Settings -> Options -> Preview feature and make sure ‘Smart narrative visual’ is turned on:
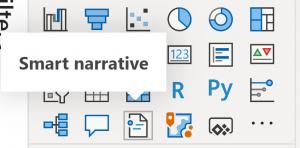
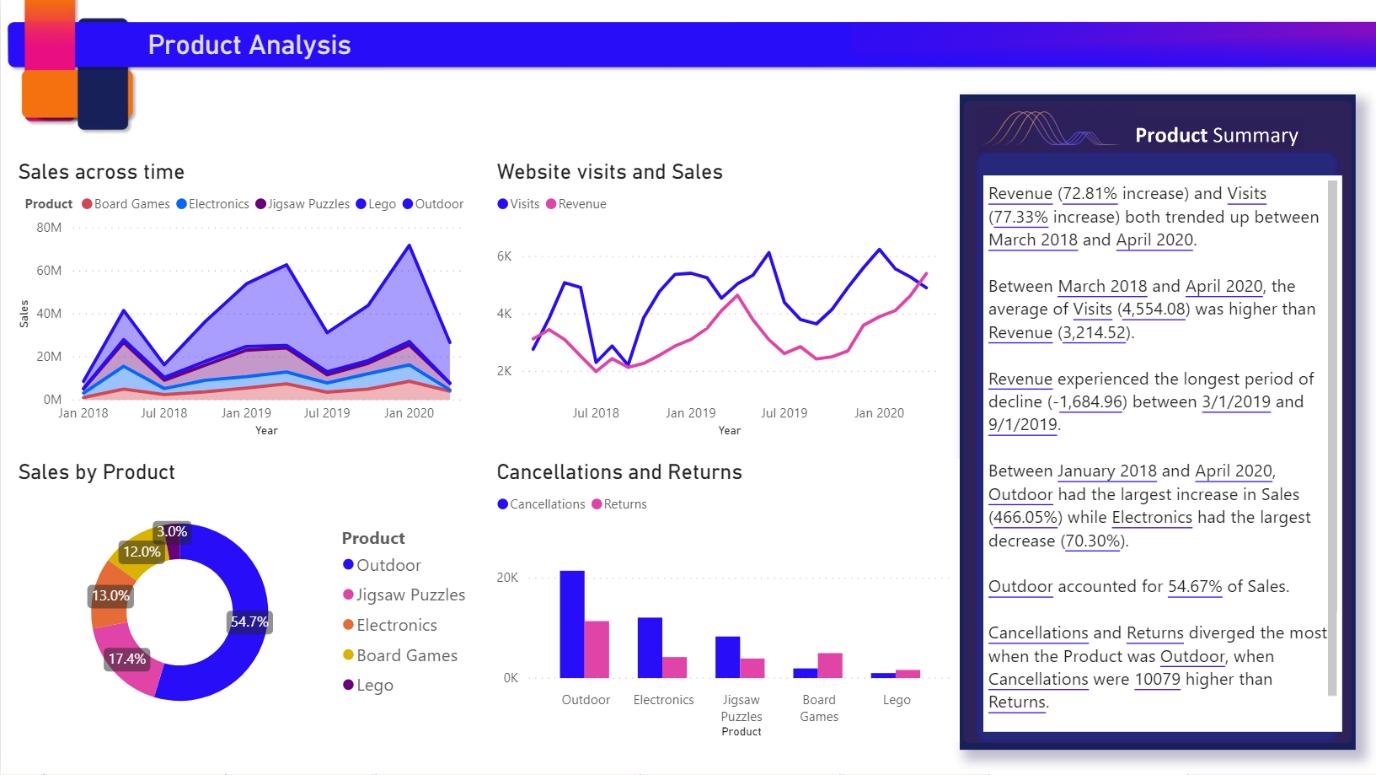
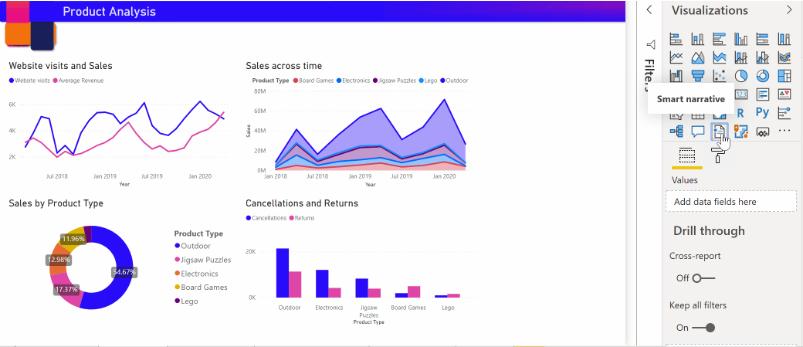
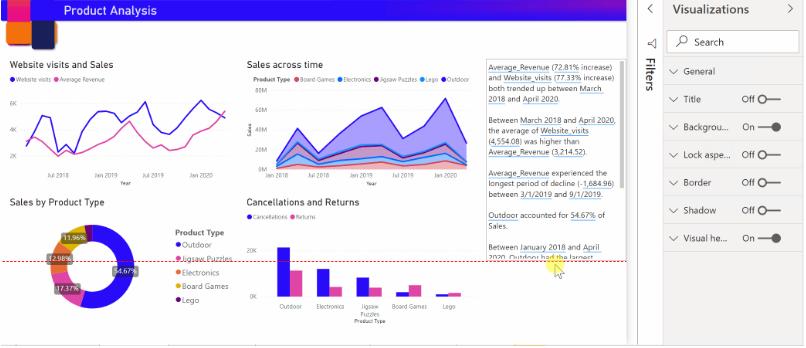
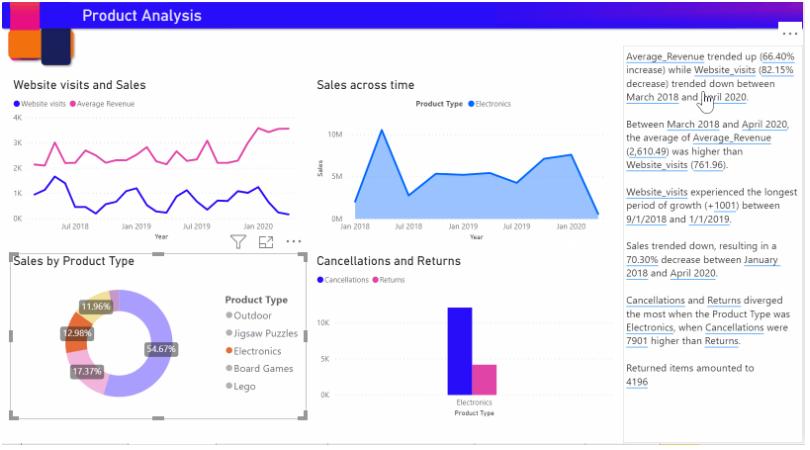
Clicking on the new smart narratives icon in the Visualization pane creates narrative based upon all the visuals on the page.
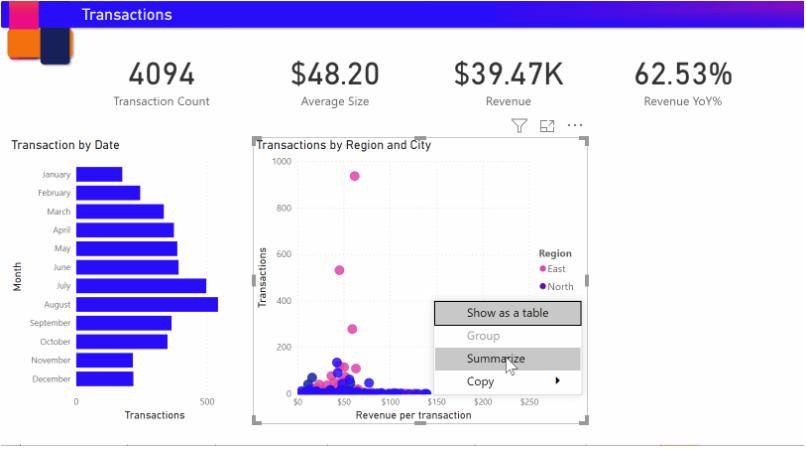
You can also right click a visual and select ‘summarize’. This will generate an automatic summary of that visualisation. For example, Power BI analyses the scatter chart visual showing the various transactions and shows which city / region has the highest revenue per transaction and highest number of transactions:
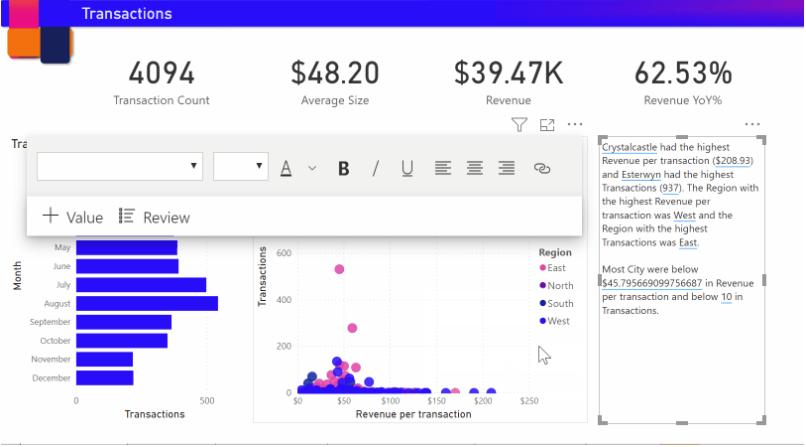
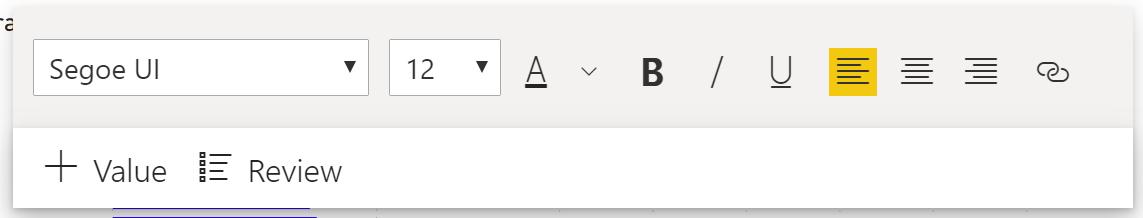
The summary is highly customisable, where you can add new text, or edit the existing text using the same controls available in the regular text box.
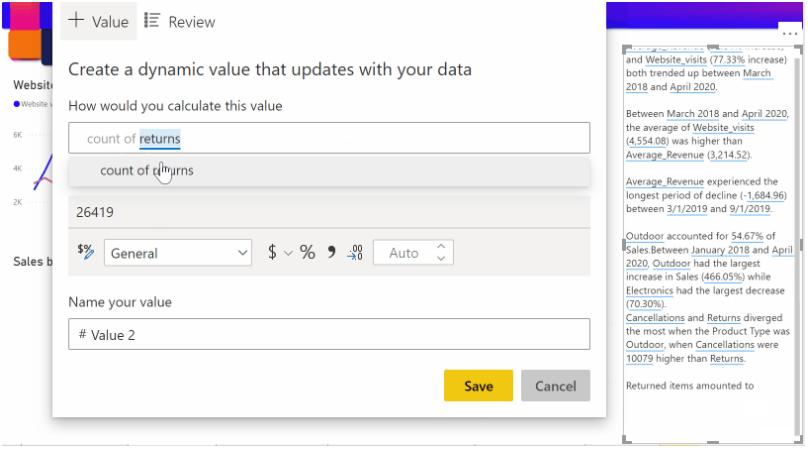
You can also customise the summary by adding dynamic values. You can map text to existing fields and measures or use natural language to define new measure to map to text.
The summary is dynamic and automatically updates the generated text and dynamic values when you cross filter.
Our clients have been crying out for something like this for years. This could be quite amazing.