September 2017 Update for Power BI Desktop
12 September 2017
This is the one the world has been waiting for! You'll get no overstatements here...
Power BI Desktop finally releases two features that were demoed back at the Data Insights Summit that really got everyone talking: drillthrough and report insights. That’s not all though, with a theming preview also available that many requested and even a new chart type (the Ribbon chart – confusing nomenclature or what!). Another one that is likely to get tongues wagging is “Explain the increase / decrease insights” preview too.
Something for everyone then – well, anyone who has Power BI Desktop anyway!
In summary, the following updates have been released:
Reporting
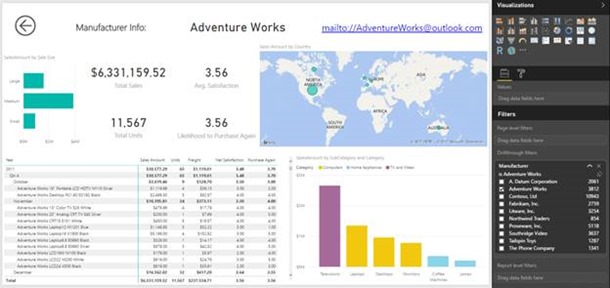
- Drillthrough to another report page
- Explain the increase/decrease insights (preview)
- Ribbon chart
- Theming preview update – chart style controls
- Accessibility improvement:
- Accessible See data
- Keyboard shortcut helper dialog
- New community visuals
- Cartesian gridline style control
- High density scatter chart sampling
- Visio visual (preview)
- Calendar by Tallan
- Enlighten Aquarium
- Impact Bubble Chart
Data connectivity
- Azure Consumption Insights connector
- Improvements to the Dynamics 365 for Financials connector.
As always, we'll be detailing these updates in our next newsletter (October). If you are not already a subscriber, why not sign up at the bottom of any SumProduct web page? And don't forget to download the latest version of Power BI Desktop here too.