PivotCharts Now Available in Excel Online
20 May 2019
PivotCharts – the graphical representation of PivotTables – have been a noticeable omission for Excel Online for some time now. But that’s all changed now. Just like in Excel Desktop, now you can create your own PivotCharts and edit them in the Excel web application.
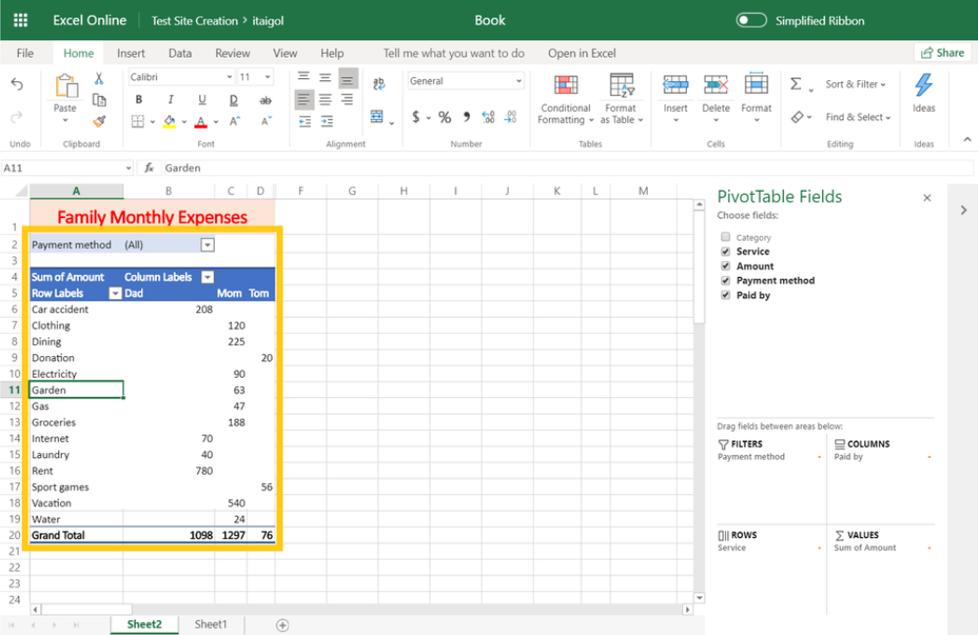
Go to the PivotTable you’d like to visualise or insert a new PivotTable. Then, select a cell in your PivotTable.
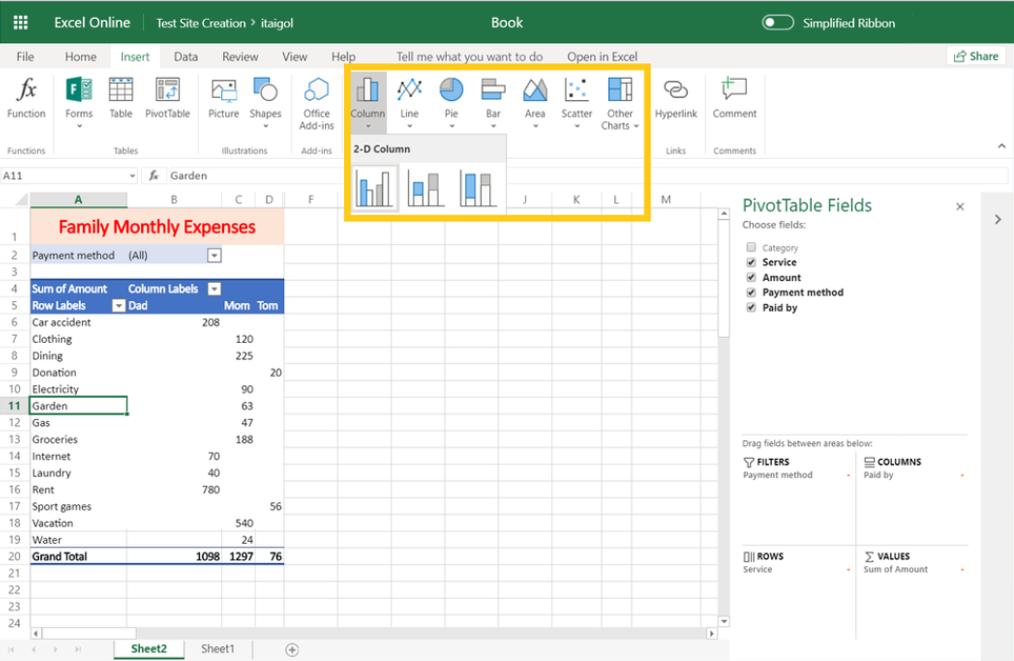
Select the Insert tab on the Ribbon, click on one of the chart buttons and choose your PivotChart type.
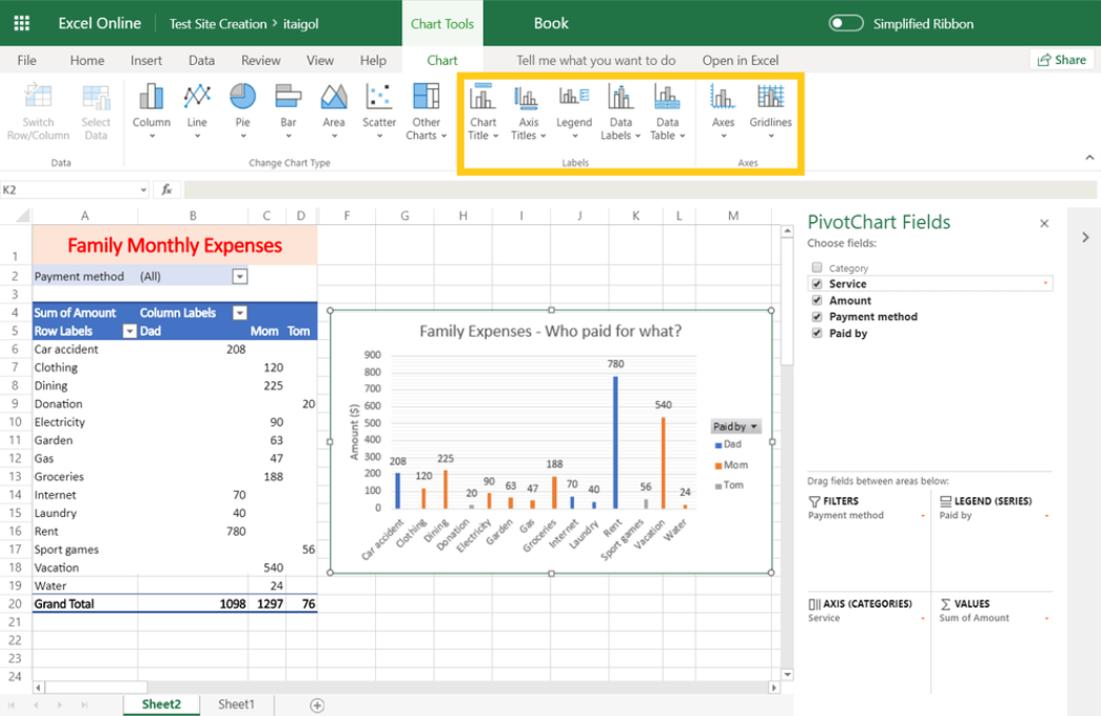
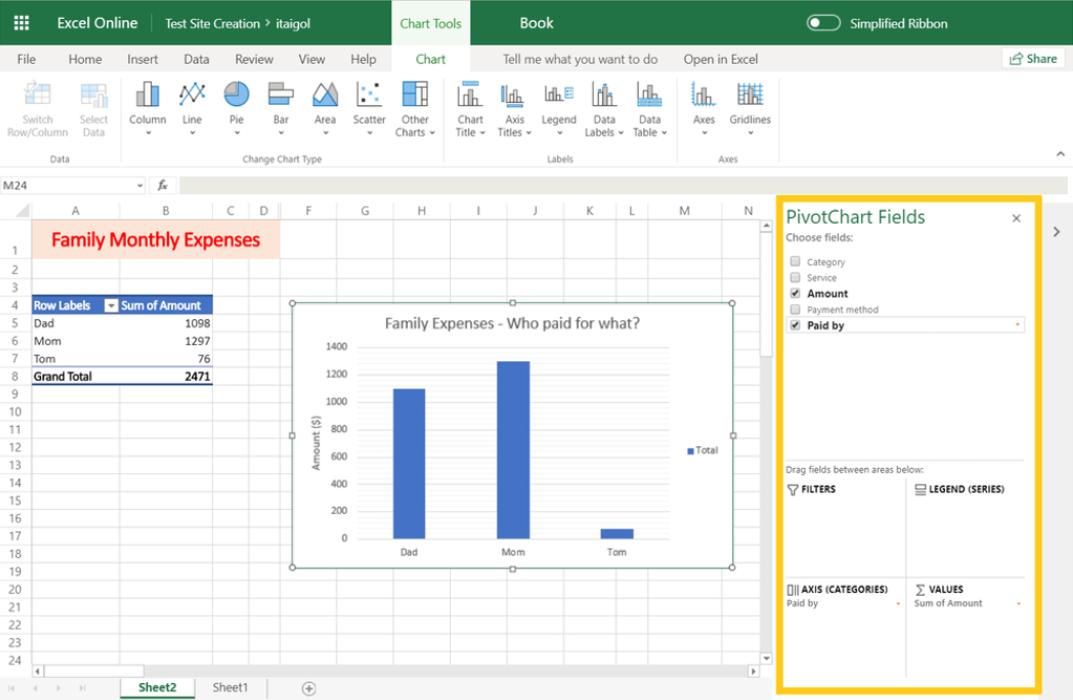
You will now have a PivotChart in Excel Online!
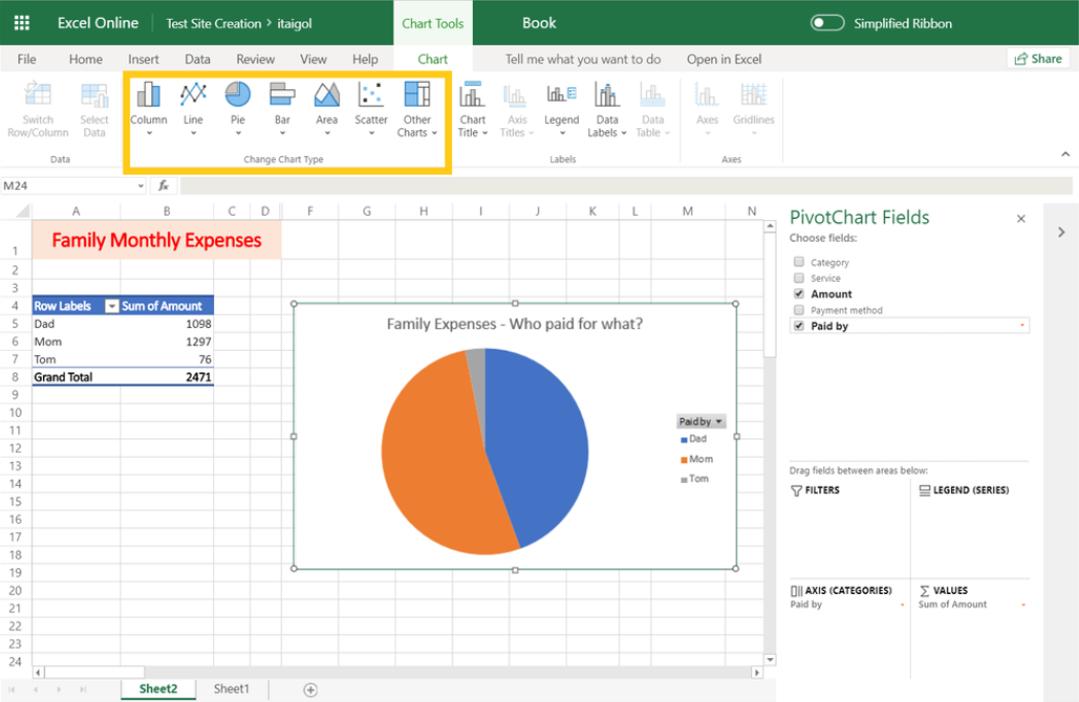
Next, you can start to play. Just like in Desktop Excel, you can utilise the options on the ‘Chart Tools’ contextual tab for editing titles, legend, labels, axes or gridlines.
You may also edit your PivotTable fields. The changes will be reflected immediately on the interactive PivotChart.
Finally, you can change the chart type for getting another point of view. Select the PivotChart and choose one of the other chart buttons instead.