
New Features for Charting in Excel for the Web
9 February 2022
Until recently, Microsoft (and to be honest, end users too) saw Excel for the Web as a “consumption-based companion app to [the] desktop version” (to quote the software company). This meant that you were limited in viewing, creating and editing charts via this medium. However, it is beginning to improve, which both free and paying customers starting to see noticeable improvements.
Microsoft has just announced some of these steps forward.
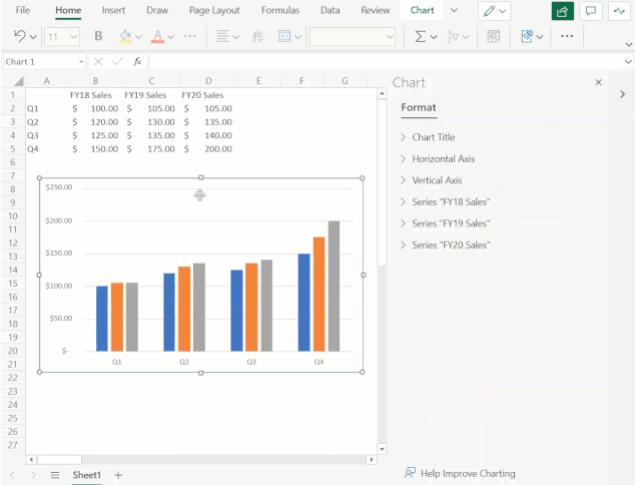
For instance, since the beginning of this month, you may now leverage the Format task pane and on-chart interactions to format charts in Excel for the Web. The Format pane provides formatting support for critical chart properties (axes, legend, data series, etc.) and makes it easy to view and navigate to each editable chart element. You are now able to make property edits to elements of a chart such as the fill / outline colour, number format, axis bounds, and so forth.
Further, you may now also select the individual elements within a chart directly, in order to launch and navigate to their respective formatting options in the Format pane. Previously, you could only select the entire chart but not any contents within the chart.
To explore these new capabilities, launch the task pane by double-clicking anywhere on the chart or by right-clicking and selecting ‘Format’. From there, you can view each chart element’s formatting options by either selecting an element within the chart or expanding the options in the Format pane.
You may now also add and remove chart elements without having to leave the Format pane. Users can leverage the new on / off toggles in the pane to choose whether to include a chart element in the chart. Alternatively, you may use the delete / backspace keys to remove a chart element that is selected. Support has also been added for adding / removing trendlines and error bars.


These are not the only improvements:
- you may now select data from non-adjacent rows to create a chart. Previously, you were limited to creating charts from a continuous range of cells:


- you may now freely change between all different chart types. Previously, some chart type changes were not supported
- undo / redo support has also been added for all chart commands and enabled sheet duplication for worksheets containing any chart type.
More in time, for sure.